Intelligence: Pass Migration
The Pass Migration intelligence report provides a seasonal breakdown of customer pass purchases. This report is organized by pass type and details how many pass purchases were lost between consecutive seasons. The report can be used to find pass purchasing trends within your customer database. You can view report results in two different modes. You can “look forward” by choosing a season and pass type to view what pass types those customers purchased the next season. You can also “look backward” by choosing a season and pass type to view what pass types those customers purchased the previous season. Data from the report can be exported to a .csv or .xlsx file for further analysis in Microsoft Excel or similar programs.
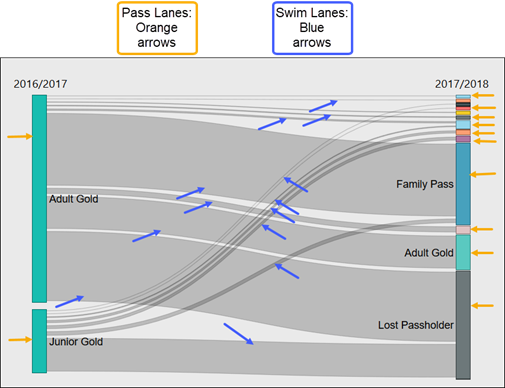
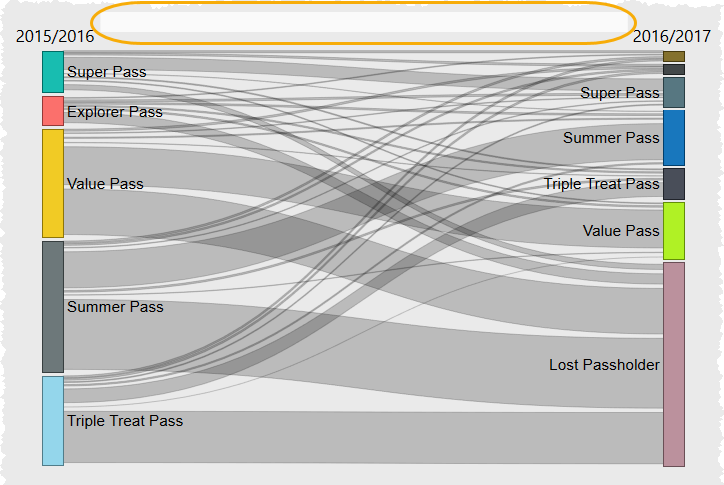
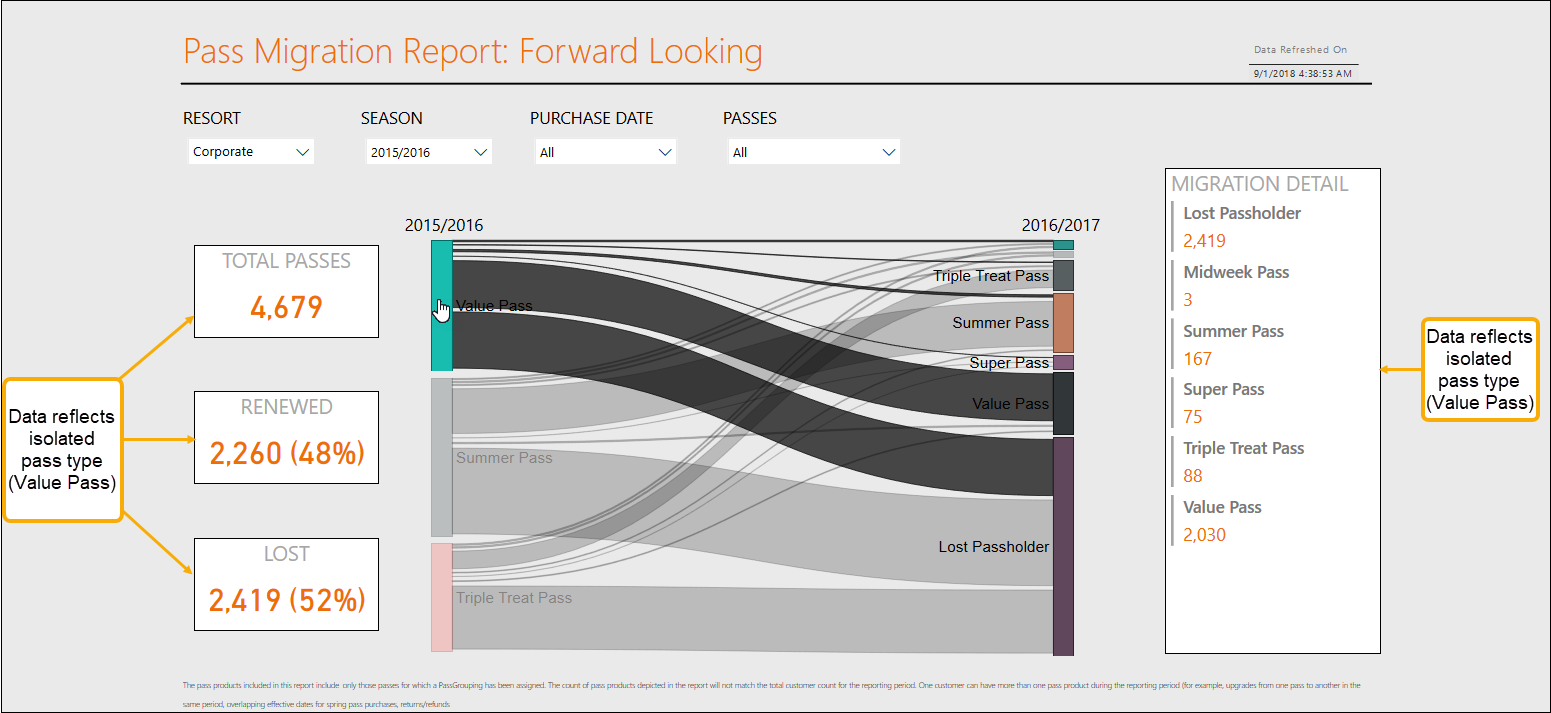
The Pass Migration report has two primary views: Forward Looking and Backward Looking. Each view presents an interactive visualization that displays customer pass purchasing trends in the given direction. These visualizations use pass lanes and swim lanes to show the migration of passes between consecutive seasons. Pass lanes represent pass types, while swim lanes represent where those pass types have migrated.
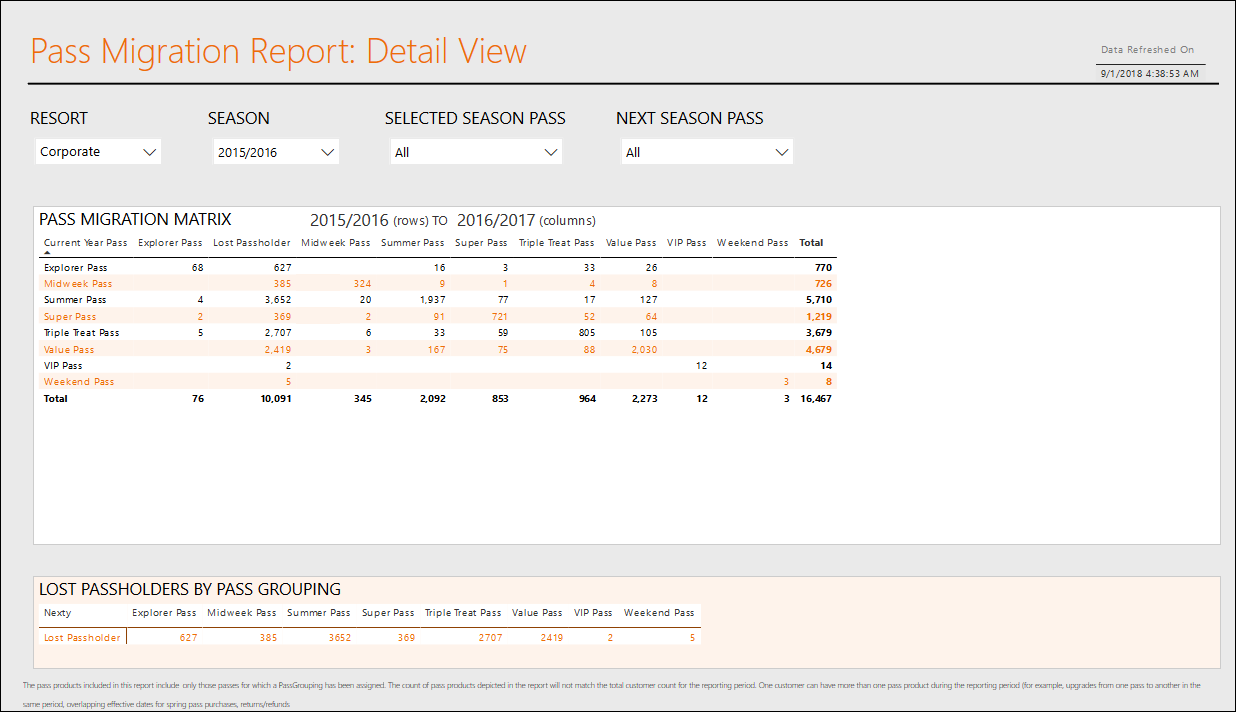
Alternatively, the Migration Detail tab displays all data found on the forward-looking visualization in a more traditional matrix.
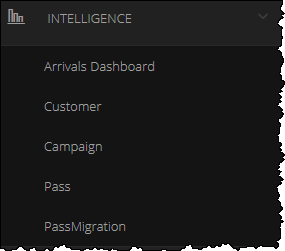
- From the left navigation menu on the Marketing Cloud dashboard, click Intelligence. The Intelligence menu expands.
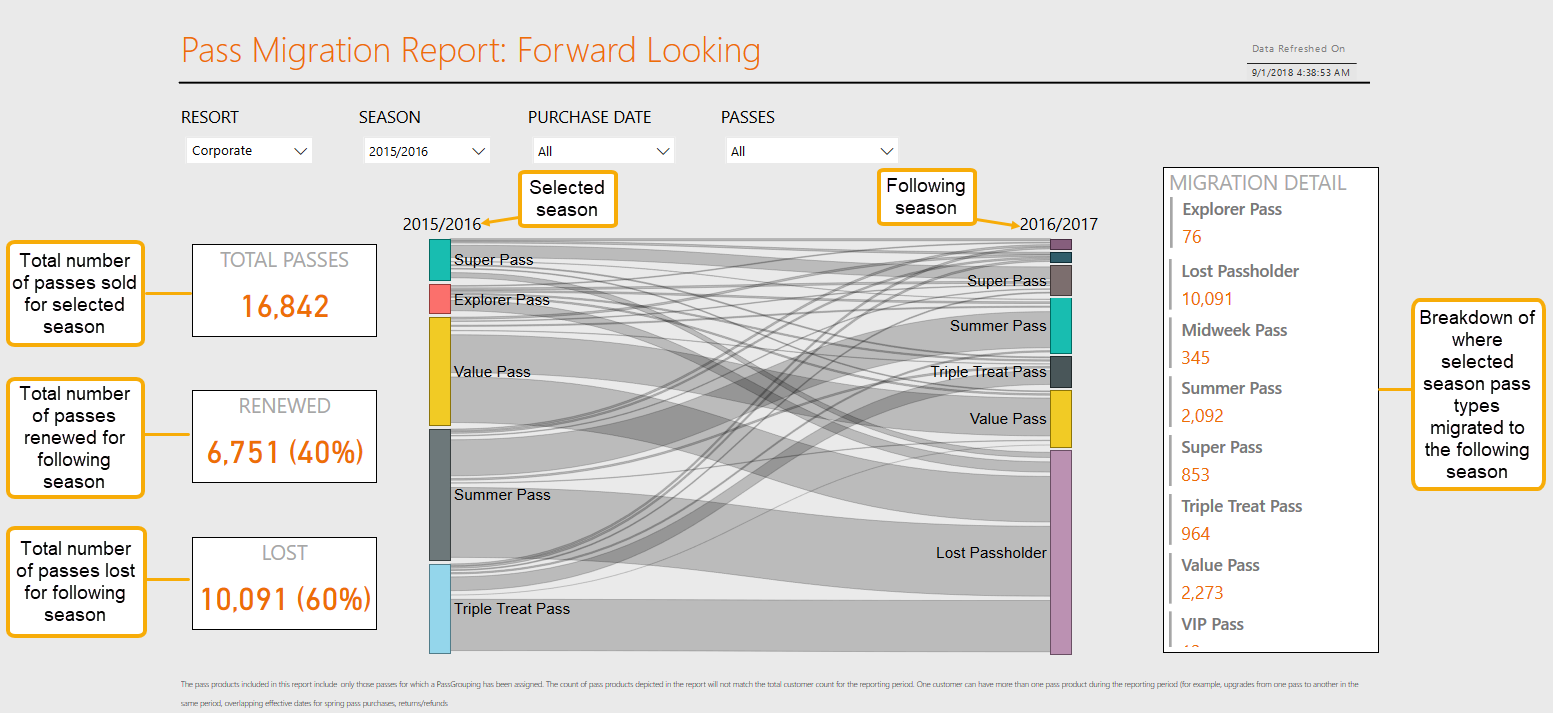
- From the Intelligence menu, click Pass Migration. The Pass Migration Report: Forward Looking screen appears showing the forward-looking visualization.
The selected season appears on the left of the visualization. The default selected season is the season preceding the current year.
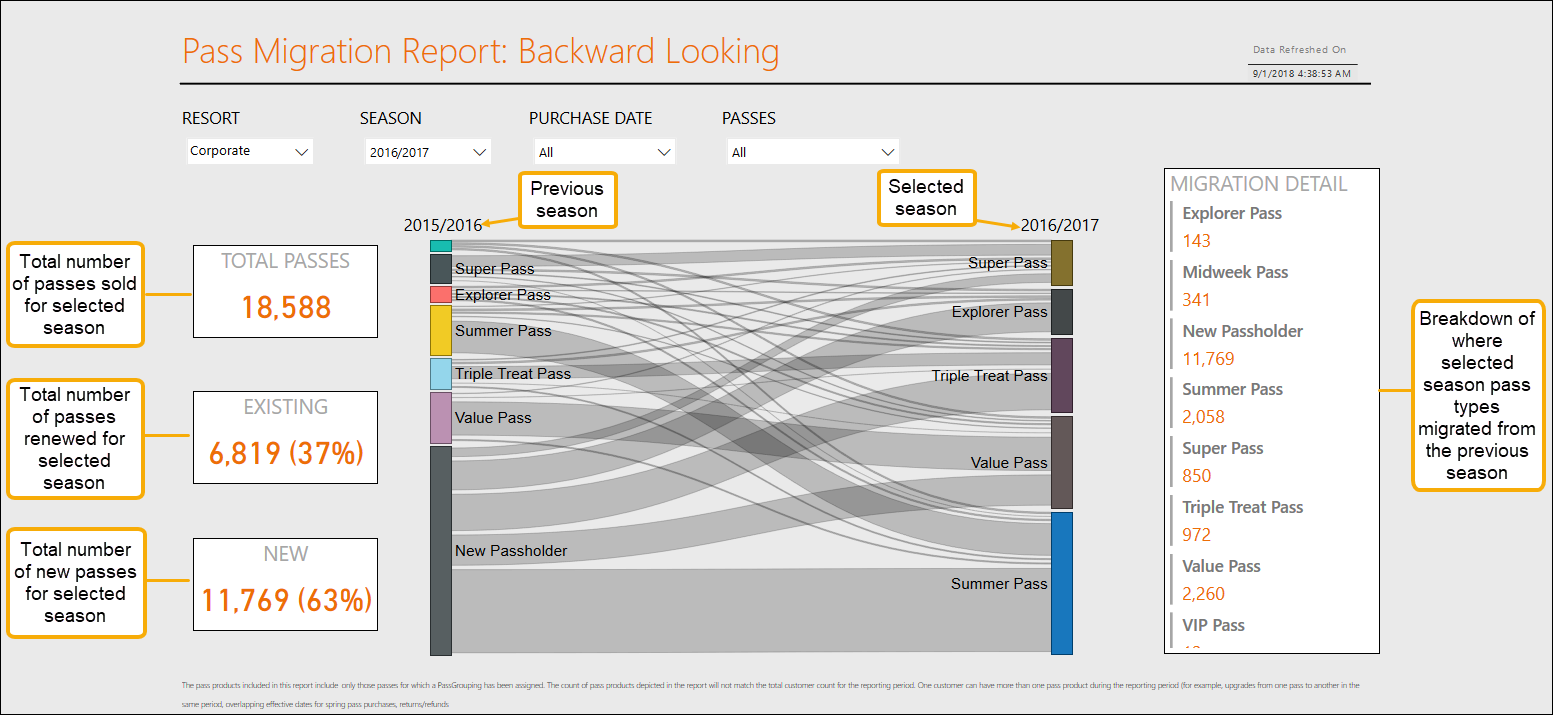
- To see the backward-looking visualization, click Backward Looking on the bottom navigation bar. The Pass Migration Report: Backward Looking screen appears showing the backward-looking visualization.
The selected season appears on the right of the visualization. The default selected season is the season preceding the current year.
- From the Resort drop-down list, choose the resort for which you want to view pass migration data.
- To view data for a season other than the default, from the Season drop-down list, choose the season from which you want to look forward/backward.
- To view data for a specific month or months, from the Purchase Date drop-down list, choose the month which you want to view pass sales. You can choose multiple months.
To view pass sales for all months in a selected season, click Select All. - To view data about specific pass types, from the Passes drop-down list, choose the pass type whose forward/backward migration you want to view. You can choose multiple pass types.
To view the forward migration of all pass types, click Select All.Note: By default, only the top five highest-selling pass types are displayed for the selected season.
- To increase/decrease the number of pass types displayed for the selected season:
- Choose the visualization by clicking directly above it. A solid white bar appears to show that the graphic is selected.
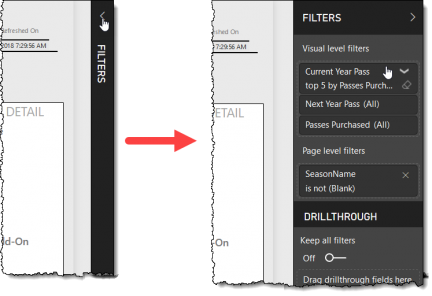
- On the right side of the screen, click the Filters pane. The expanded Filters pane appears.
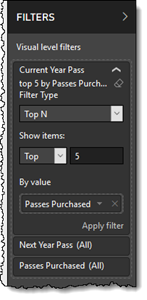
- Click the Current Year Pass box. The Current Year Pass filter menu appears.
- From the Show Items drop-down list, select Top (highest-selling pass types) or Bottom (lowest-selling pass types).
- In the numeric field, enter the number of pass types you want to view.
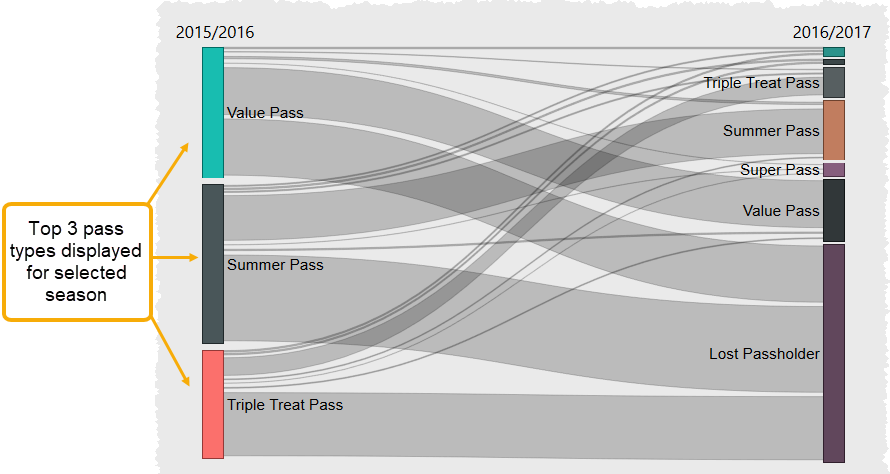
Note: The number of pass types entered in the Current Year Pass filter menu always overrides choices made from the Passes drop-down list. For example, if you enter “Top 3” in the Current Year Pass filter menu and choose four (4) pass types from the Passes drop-down list, only the top three (3) pass types are displayed.
- Click Apply filter. The visualization updates to reflect your changes.
- To isolate a pass type, click on its corresponding pass lane. The pass lane and its corresponding swim lanes are highlighted. Data in the information boxes changes to reflect the isolated pass type.
- To isolate a pass type, click on its corresponding pass lane. The pass lane and its corresponding swim lanes are highlighted. Data in the information boxes changes to reflect the isolated pass type.
Note: Pass types from either season on the visualization can be isolated.
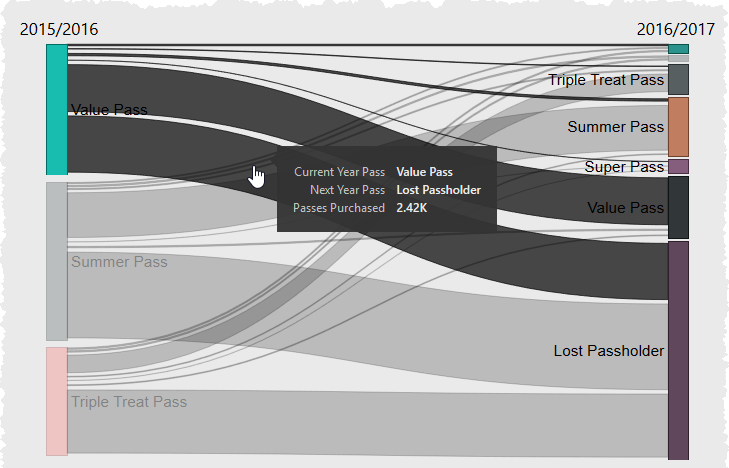
- To further isolate a pass type, hover your cursor over a swim lane. A pop-up box displays the Current Year Pass type, Next (or Previous) Year Pass type, and number of passes that have migrated.
To populate the information boxes with data from a specific swim lane, click on the swim lane.
Note: The pass count displayed in the pop-up box may not exactly match the pass count displayed in the information boxes. This is because the information boxes show a distinct customer count, whereas the pop-up box shows a distinct pass count. For example, if a single customer purchases two (2) of the same pass types, that purchase will be counted as one (1) transaction in the information boxes and two (2) transactions in the pop-up box.
To see an alternate view of the forward-looking visualization, click the Migration Detail tab on the bottom navigation bar. The Pass Migration Matrix appears.
The selected season’s pass types appear in the matrix rows. The next season’s pass types appear in the matrix columns.
Below the Pass Migration Matrix, the Lost Passholders by Pass Grouping table displays how many passes were lost between the selected and next season. The table is organized by pass type.
