Marketing Cloud Survey Reports
Survey reports detail information about guest responses to surveys conducted by your resort. Each Survey report can be filtered to only include data from:
- Specific surveys
- Surveys conducted during specific date ranges
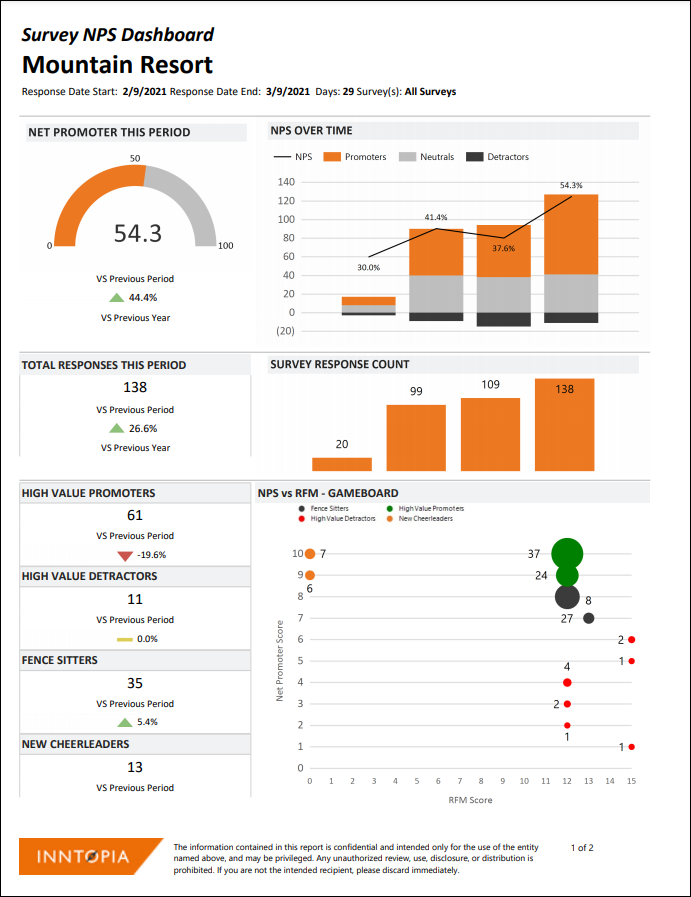
The NPS Dashboard analyzes NPS (Net Promoter Score) survey results.
Net Promoter Score, or NPS, is the industry standard metric used to gauge customer satisfaction by asking the survey question, “How likely are you to recommend X to a friend, family member, or colleague?” Responses from 0 to 10 are divided into the following categories:
- Promoters – Respondents submitting a 9 or 10
- Neutrals or Passives – Respondents submitting a 7 or 8
- Detractors – Respondents submitting responses 0 through 6
NPS = % promoters minus % detractors
The NPS Dashboard also compares NPS results with your guest’s RFM (Recency, Frequency, and Monetary) scores to provide an overall view of your guests.
- Log into Inntopia Marketing Cloud and from the left menu, click Reports. The Reports menu expands.
- From the Reports menu, click Survey. The Survey menu expands.
- From the Survey menu, click NPS Dashboard. The Report Viewer – NPS Dashboard screen appears.
- To determine the dashboard parameters for data display:
- In the Start Date and End Date filters, determine the date range for the surveys included in the data set.
- In the Survey ID filter, select which survey(s) to include in the data set. By default, all surveys are selected. You can select multiple surveys.
- To generate the dashboard, click Retrieve Report.
A preview of the NPS Dashboard appears with limited data.
-
To view the complete dashboard data, click either the Excel or PDF button to export the dashboard.
From your browser, download and open the file.
Note: If the file opens in a read-only format, enable editing to use the file.
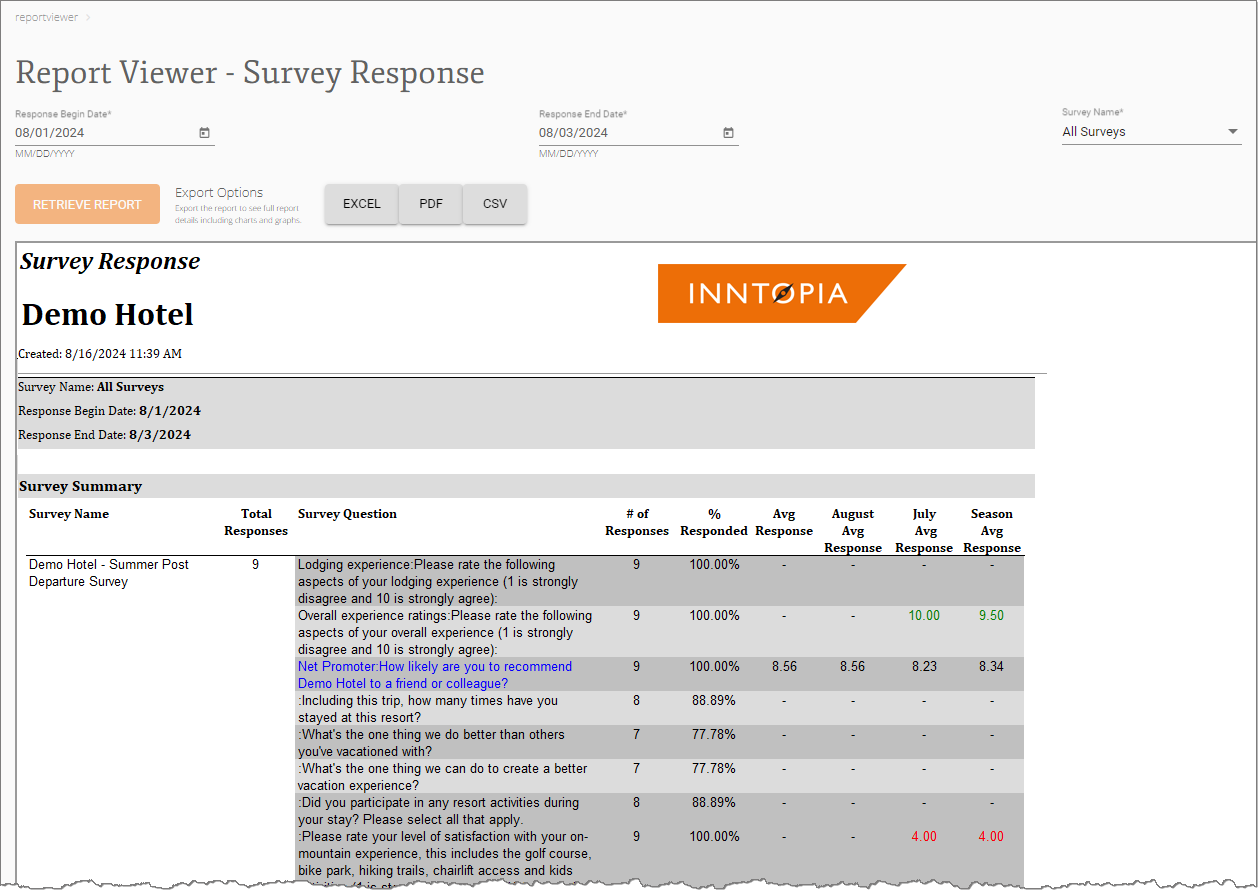
The Survey Response report shows generalized guest response data for selected surveys, including the average response per question for:
- each of the two months prior to Response Begin Date, and
- the season in which the survey was conducted.
When compared to the overall average responses, the prior months and seasonal average responses indicate whether recent survey feedback has been increasingly positive (green numbers) or negative (red numbers).
Use the following parameters to run the report and filter report data:
- Response Begin Date* – Start of the date range for the report
- Response End Date* – End of the date range for the report
- Survey Name* – Select one or all available surveys to include in the report.
* = required parameter
- Survey Name – Name of survey
- Total Responses – Number of responses received for the survey
- Survey Question – Specific question asked of guests within the survey
- # of Responses – Number of guests who responded to the specific question
- % Responded – Percentage of guests who responded to the specific question
- Avg Response – Average number of guests who responded to the specific question
- <Month> Avg Response – Average number of guests who responded to the specific question for each of the two prior months
- Season Avg Response – Average number of guests who responded to the specific question for the season
Subsequent pages (or worksheets if exported to Microsoft® Excel), display the full results of each guest’s survey.
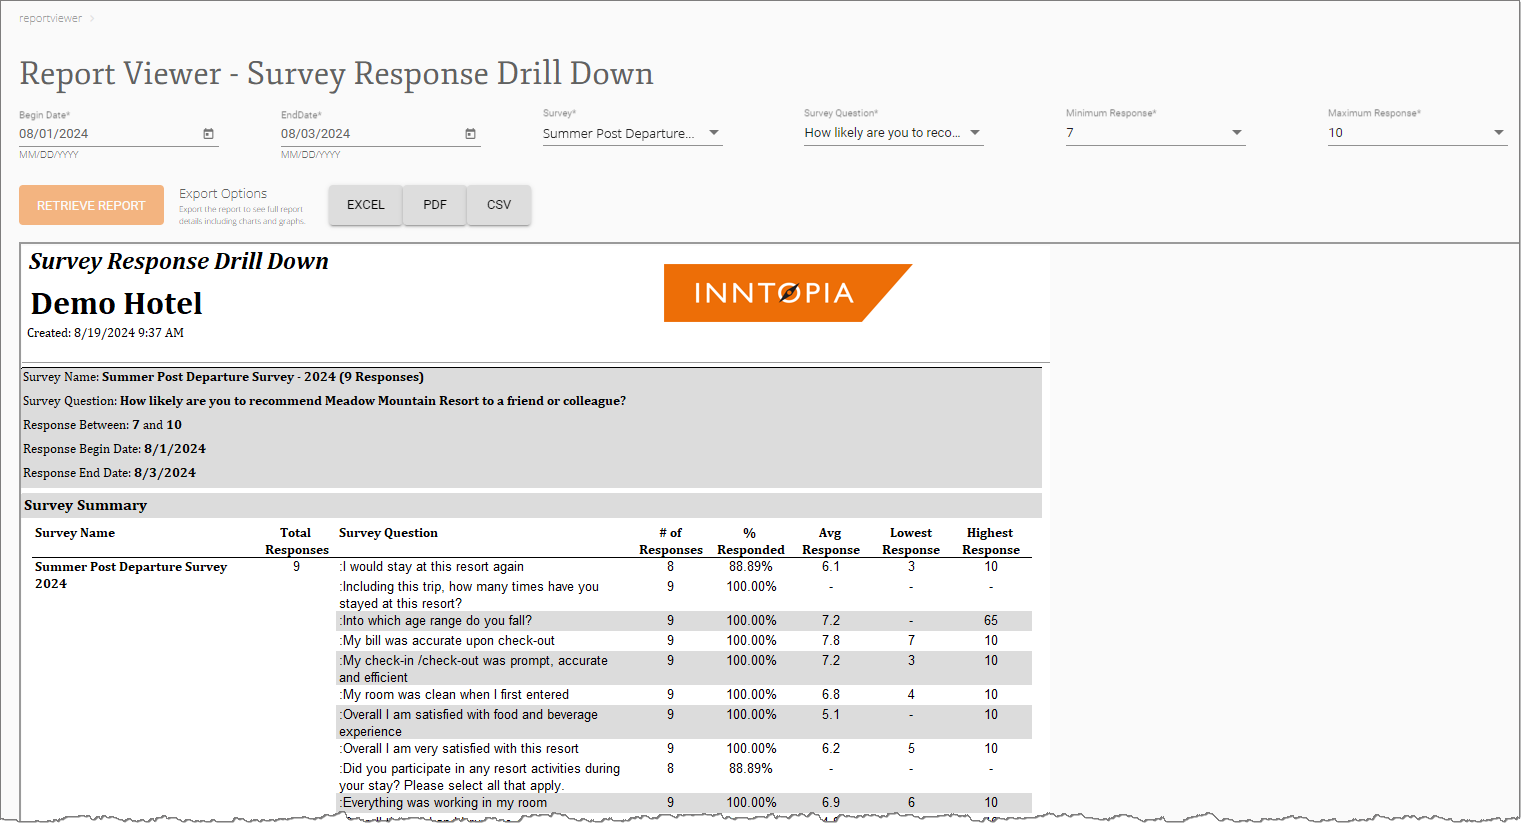
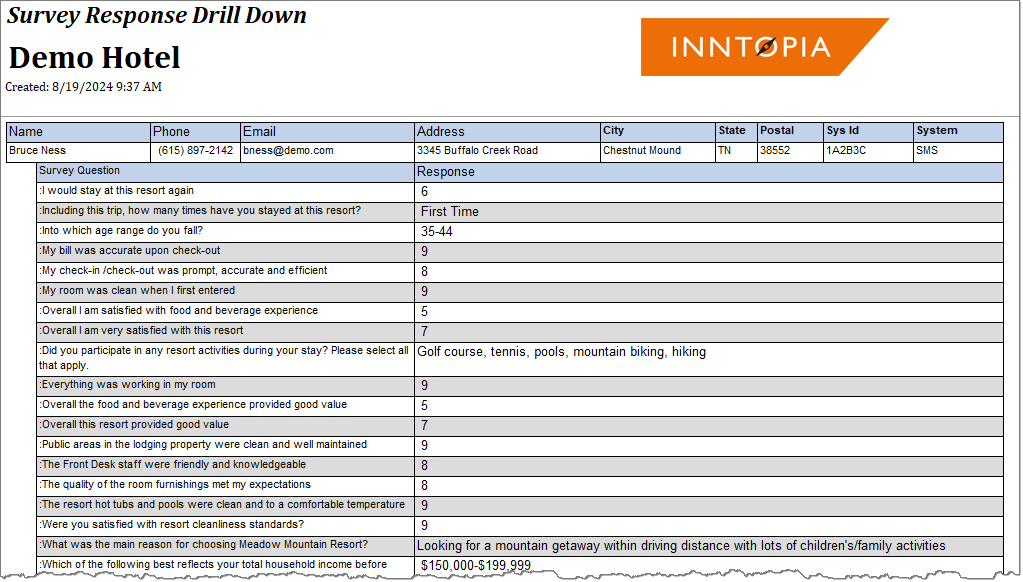
The Survey Response Drill Down report gives a concentrated overview of all guest responses to selected survey questions.
Use the following parameters to run the report and filter report data:
- Begin Date* – Start of the date range for the report
- End Date* – End of the date range for the report
- Survey* – Select one or all available surveys to include in the report.
- Survey Question* – General overall question for the survey
- Minimum Response* – Lowest numerical rating response to include in the report
- Maximum Response* – Highest numerical rating response to include in the report
* = required parameter
- Survey Name – Name of the survey
- Total Responses – Number of responses to the survey
- Survey Question – Specific question asked of guests within the survey
- # of Responses – Number of responses to the specific survey question
- % Responded – Percentage of responses for the specific survey question
- Avg Response – Average response rating for the specific survey question (based on scores of 1–10)
- Lowest Response – Lowest response rating for the specific survey question (based on scores of 1–10)
- Highest Response – Highest response rating for the specific survey question (based on scores of 1–10)
Subsequent pages (or worksheets if exported to Microsoft® Excel), display the full results of each guest’s survey.
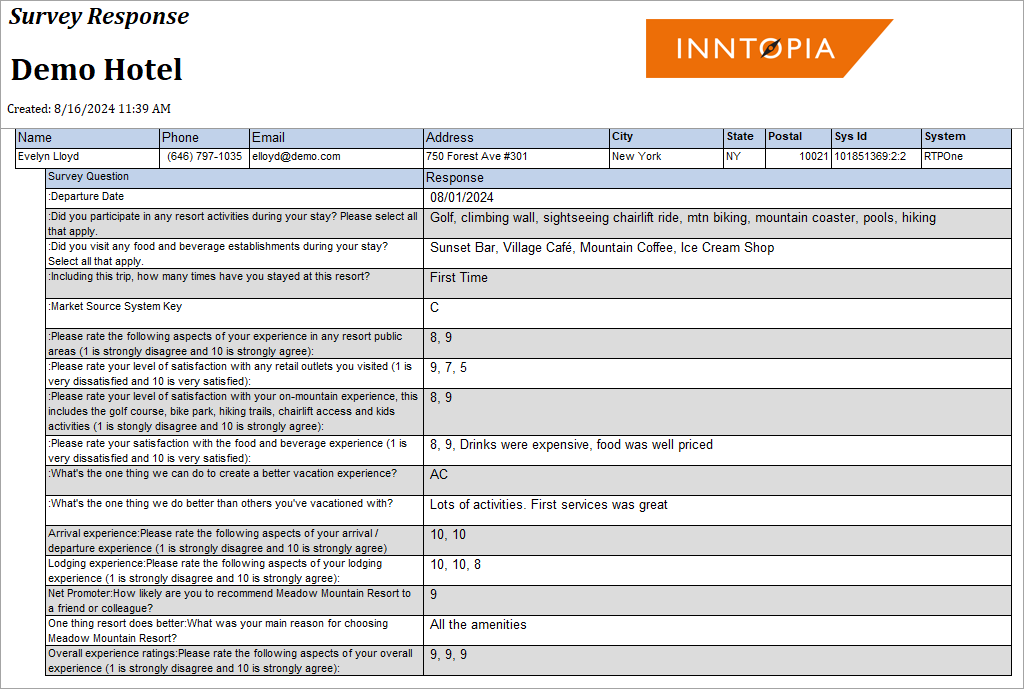
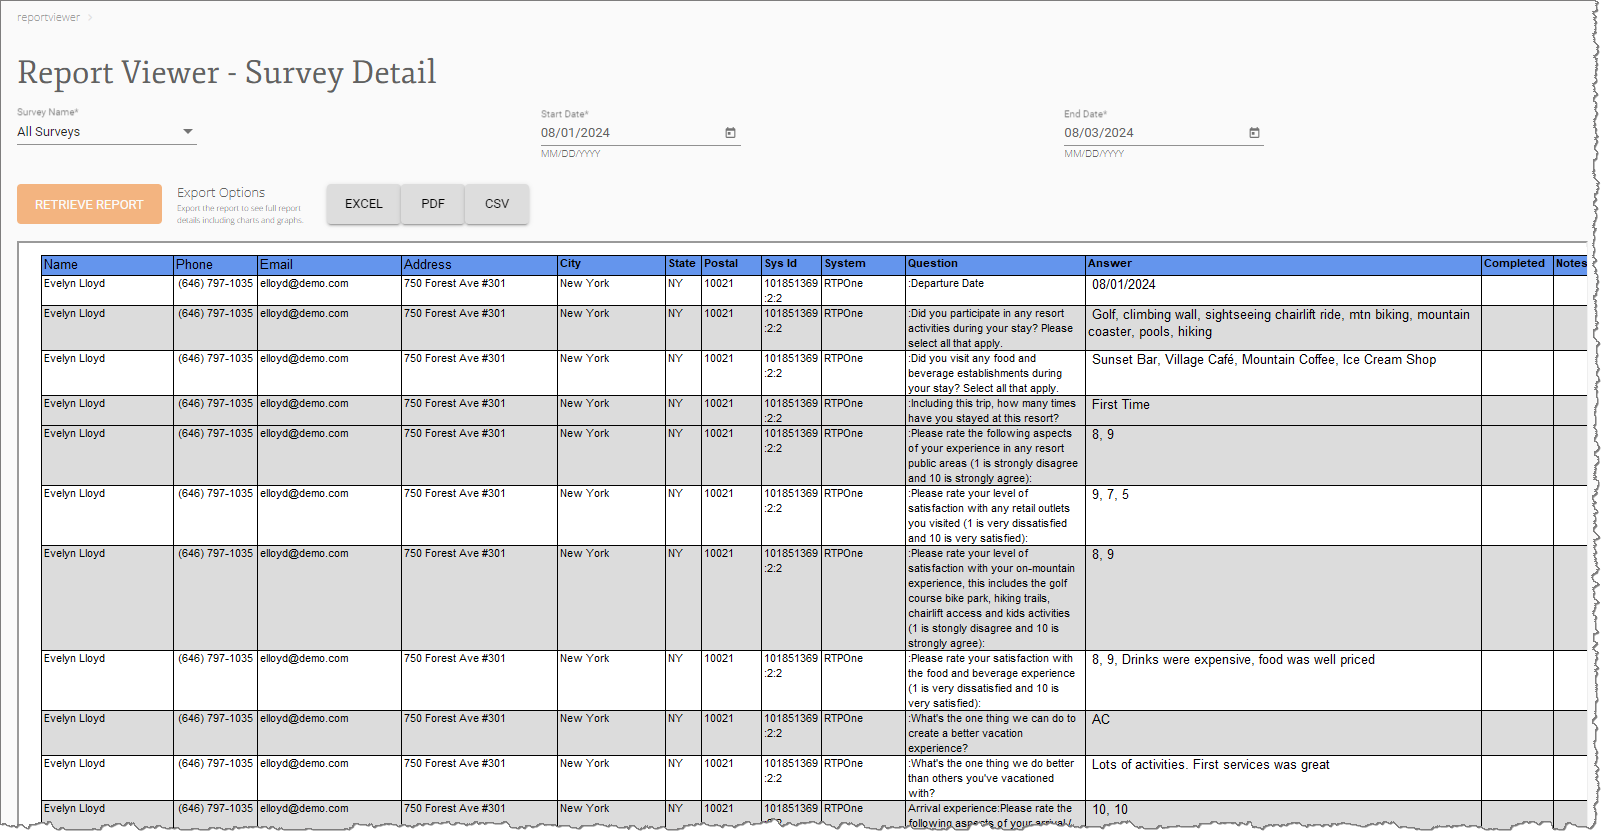
In addition to their personal information, the Survey Detail report shows a guest's individual responses to survey questions on a unique tab. Responses are organized by individual guest name (rather than by individual guest response).
If available, the report also shows from what system the survey was collected and its corresponding System ID.
Use the following parameters to run the report and filter report data:
- Survey Name* – Select one or all available surveys to include in the report.
- Start Date* – Start of the date range of the report.
- End Date* – End of the date range of the report.
* = required parameter
- Name – Guest name
- Phone – Guest phone number
- Email– Guest email address
- Address– Guest mailing address
- City – Guest city
- State– Guest state
- Postal – Guest postal code
- Sys Id – Confirmation number from the source system of guest most recent purchase
- System – Source system of guest most recent purchase
- Question– Survey question
- Answer – Guest response to a survey question
- Completed – Field not currently in use
- Notes – Field not currently in use
In addition to their personal information, the Survey Detail Pivoted report is organized by guests' individual responses to survey questions (rather than by individual guest name).
- Responses are organized by individual guest response.
- If available, the report also shows the system ID for the system on which the survey was collected.
- This report can be run for either one survey at a time or for all available surveys. For example, you cannot select two or three surveys.
- Because it provides so much information, Inntopia recommends choosing dates for this report between one and seven days.
- This report is best viewed in Microsoft Excel.
Use the following parameters to run the report and filter report data:
- Survey* – Select one or all available surveys to include in the report.
- Start Date* – Enter the date from which report results begin.
- End Date* – Enter the date on which report results end.
* = required parameter
- System Id – Identification number for the system on which the survey was collected
- Date – Date guest completed the survey
- First Name – Guest first name
- Last Name – Guest last name
- Address – Guest mailing address
- City – Guest city
- State– Guest state
- Postal Code – Guest postal code
- Email – Guest email address
- Phone Number – Guest phone number
- Departure Date – Reservation departure date
- Survey Question(s) – Individual survey question and the guest response
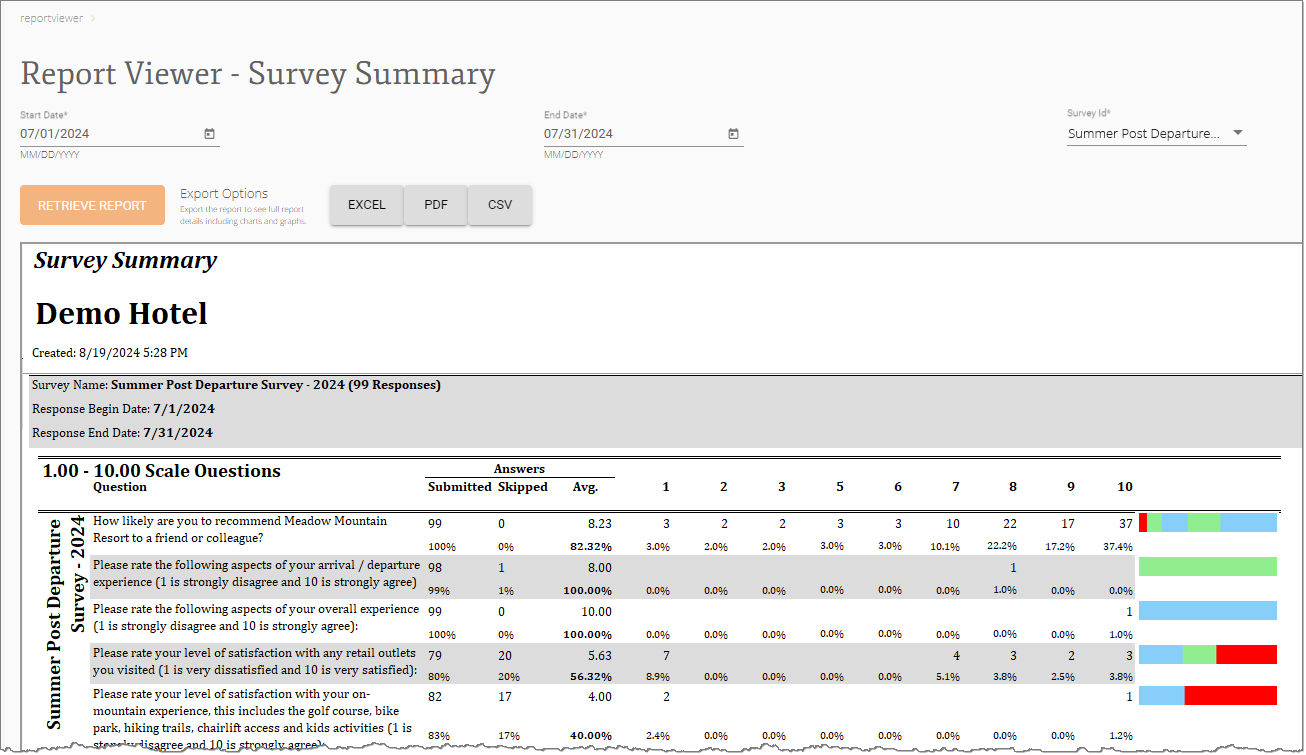
The Survey Summary report gives an overview of all customer responses to questions on selected surveys.
Use the following parameters to run the report and filter report data:
- Start Date* – Start of the date range for the report
- End Date* – End of the date range for the report
- Survey Id* – Specify which survey to include in the report
* = required parameter
- Question– Survey question
- Answers
- Submitted– Number and percentage of submitted answers
- Skipped– Number and percentage of skipped answers
- Avg.– Number and percentage of the average response
- Response (1.00 – 10.00)– Number and percentage of responses with that score
- Chart (not labeled) – When exported, colored-coded NPS responses:
- Blue – 9 and 10
- Green – 7 and 8
- Yellow – 5 and 6
- Orange – 3 and 4
- Red – 1 and 2
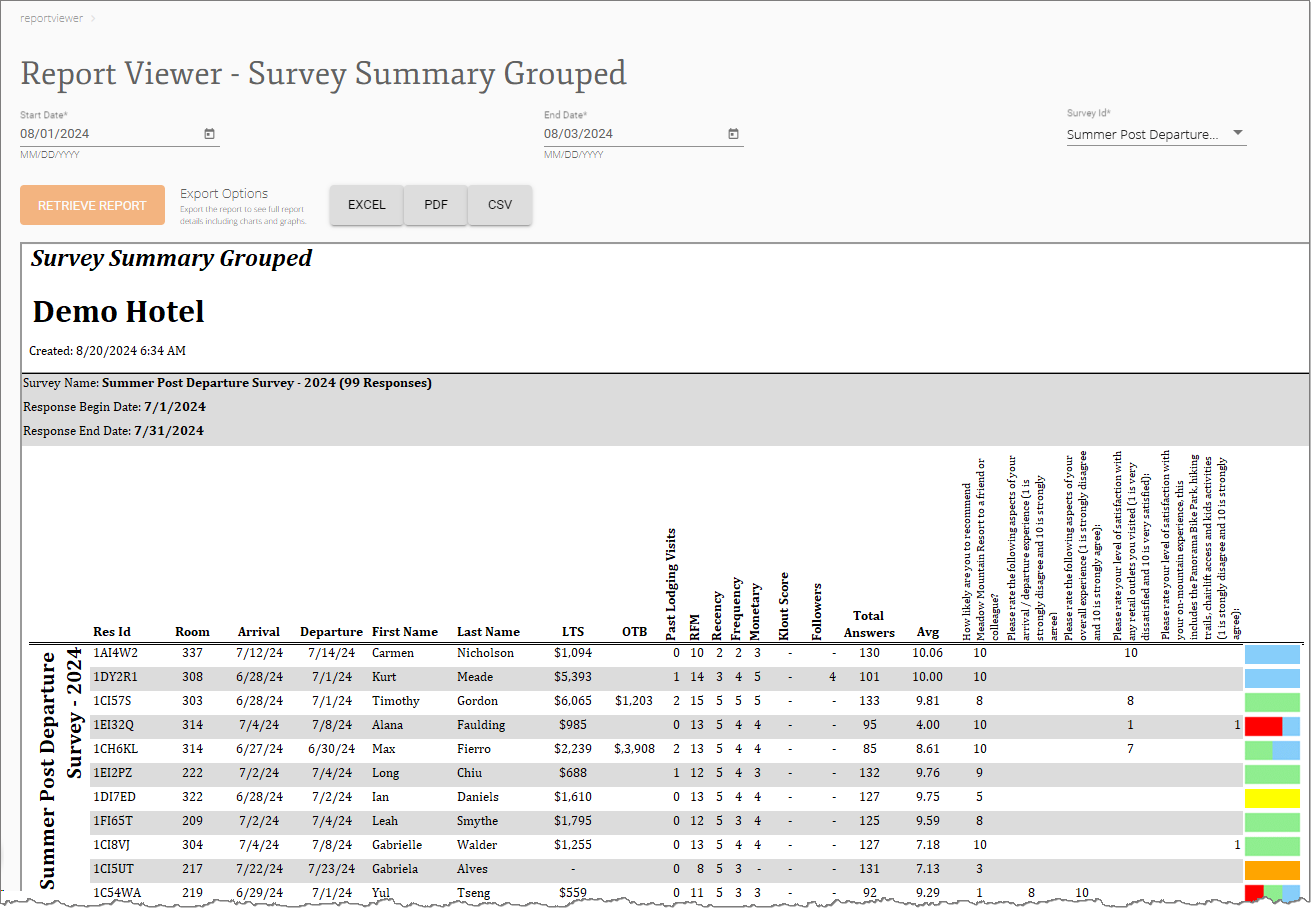
The Survey Summary Grouped report shows every customer's individual responses to questions on selected surveys. It also includes metrics about each customer's historical visiting and spending habits.
Use the following parameters to run the report and filter report data:
- Start Date* – Start of the date range for the report
- End Date* – End of the date range for the report
- Survey Id* – Select one or all available surveys to include in the report.
* = required parameter
- Res Id – Reservation ID
- Room– Room number of the reservation
- Arrival Date– Guest arrival date
- Departure Date– Guest departure date
- First Name – Guest first name
- Last Name– Guest last name
- LTS($) – Lifetime Spend
- OTB – Value of all reservations on-the-books
- Past Lodging Visits – Number of past lodging stays
- RFM – Recency-Frequency-Monetary score
- Recency Score– Time passed since the guest last visit
- Frequency Score– Regularity of guest visits
- Monetary Score– Dollar amount spent during guest visits
- Klout Score – This field is no longer used
- Followers– Number of social media followers
- Total Answers – Number of questions answered in survey
- Avg – Average Answer
- Individual Answers– Answers to the individual survey questions
- Chart (not labeled) – When exported, colored-coded NPS responses:
- Blue – 9 and 10
- Green – 7 and 8
- Yellow – 5 and 6
- Orange – 3 and 4
- Red – 1 and 2
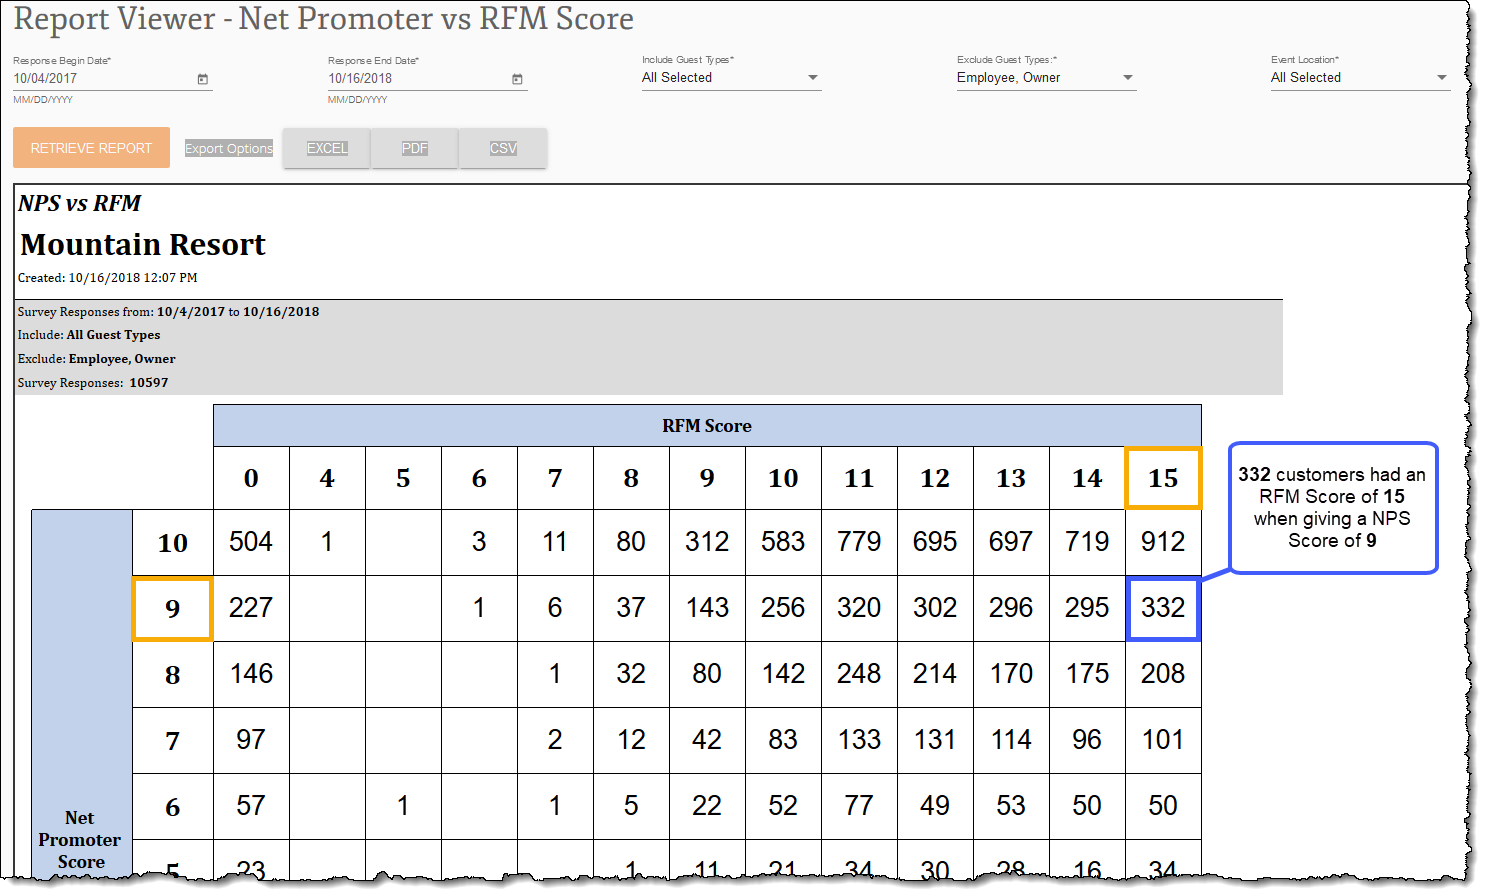
The Net Promoter vs RFM Score report creates a matrix to show how many customers with a specific Recency-Frequency-Monetary Score (RFM) gave a specific Net Promoter Score (NPS) when completing a resort survey. Matrix columns represent a customer's RFM Score while matrix rows represent the NPS given by that customer. The total number of customers who held a particular RFM Score while responding with a particular NPS is found where a row meets a column. You can filter results to only include responses from specific date ranges and/or surveys. You can also include and/or exclude specific guest types.
Use the following parameters to run the report and filter report data:
- Response Begin Date* – Start of the date range for the report
- Response End Date* – End of the date range for the report
- Survey* – Select one or all available surveys to include in the report.
- Include Guest Types* – Type of guest to include in the report. By default, all guest types are included.
- Exclude Guest Types* – Type of guest to exclude from the report. By default, employee and owner guest types are excluded.
* = required parameter
Note: For information on selecting Include vs Exclude parameters, click here.
- RFM Score – Guest RFM Score
- NPS Score – Guest survey response score
The Include and Exclude Guest Type filters determine which guest types will be included in the data set. While they work in tandem, each filter qualifies the data differently. To explicitly remove a guest type from the data set, use the Exclude Guest Type filter.
Guests can be assigned to multiple guest types. The following example illustrates how different usage of the Include and Exclude Guest Types filters affect a data set. Ten guests are assigned to between one and four different guest types.
| Guest Types | ||||
|---|---|---|---|---|
| Record | 1 | 2 | 3 | 4 |
| Guest 1 | Winter | Summer | Local | |
| Guest 2 | Family | Winter | Summer | |
| Guest 3 | Family | Local | Summer | |
| Guest 4 | VIP | |||
| Guest 5 | Employee | Winter | Summer | |
| Guest 6 | Family | VIP | Winter | |
| Guest 7 | Winter | Family | Local | Summer |
| Guest 8 | VIP | Local | Winter | |
| Guest 9 | Family | Local | Summer | |
| Guest 10 | Employee | Summer | ||
- Example 1 – Deselect VIP from the Include Guest Type filter and select None from the Exclude Guest Type filter.
- Guest 4 will not be counted in the data set.
- Guests 6 and 8 will be counted because Guests 6 and 8 are also assigned to guest types that are included in the data set (the other guest types are selected within the Include Guest Types filter).
- Example 2 – Select All from the Include Guest Type filter and VIP from the Exclude Guest Type filter.
- Guests 4, 6, and 8 will not be counted in the data set because all guests assigned to the VIP guest type have been excluded from the data set regardless of the other assigned guest types.
Note: This list of reports is not inclusive. You may see more reports than those listed above in your Marketing Cloud account.


