Deliverability Dashboard
The Deliverability dashboard provides metrics in a single view, allowing you to quickly identify potential deliverability problems and diagnose issues. The Deliverability dashboard reports by domain and the individual campaign emails, providing a view of long-term trends and the ability to drill into potential offenders.
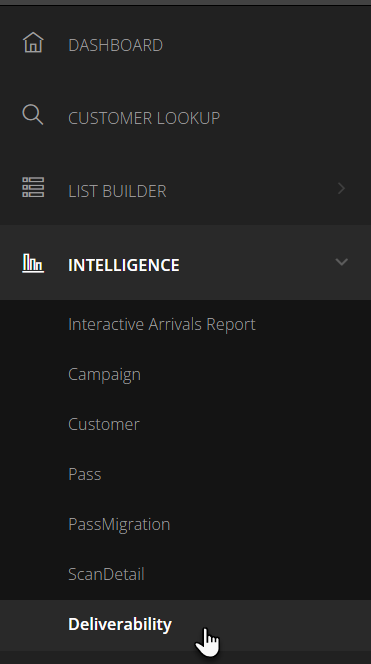
- Log into Inntopia Marketing Cloud and from the left menu, click Intelligence. The Intelligence menu expands.
- From the Intelligence menu, select Deliverability.
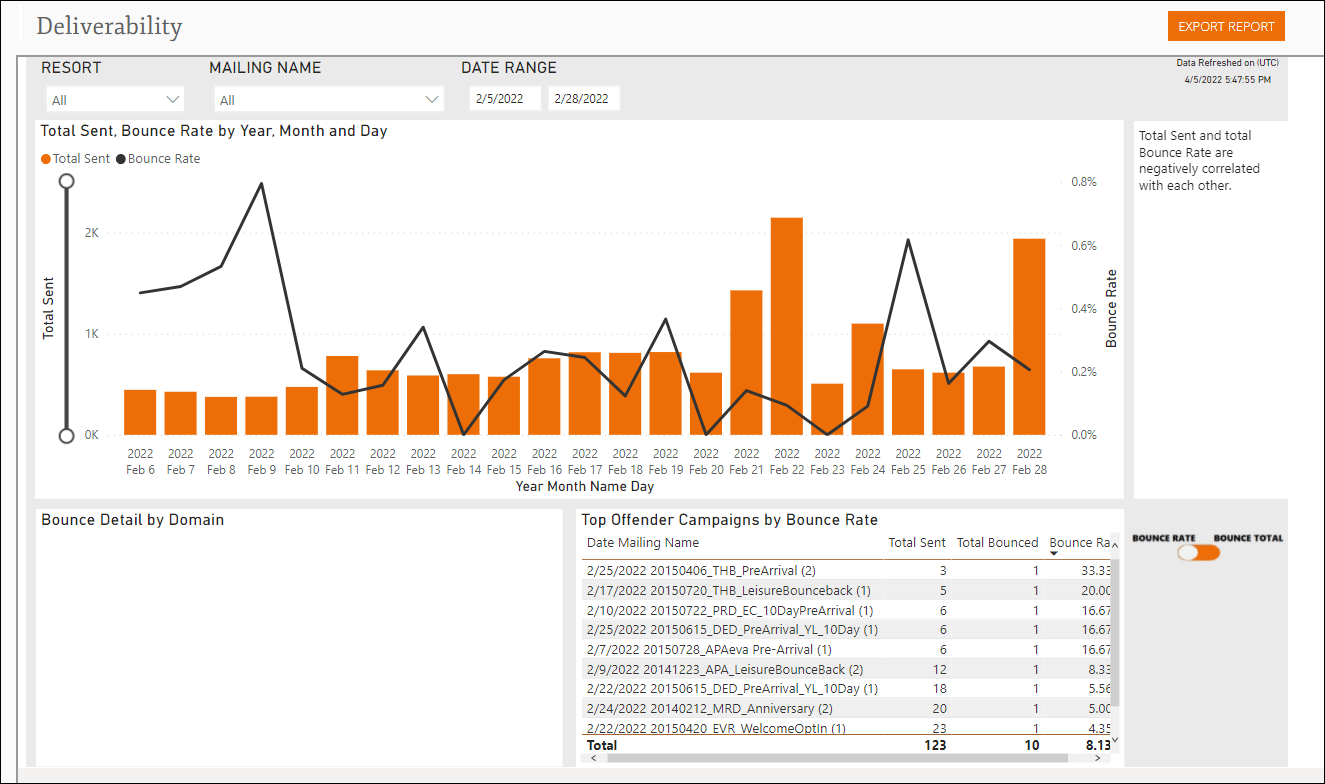
The Deliverability dashboard appears.
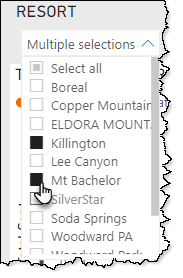
- In the Resort drop-down list, all available resorts are pre-selected by default. To select one or more individual resorts to include in the data set:
- From the Resort drop-down list, click the Select All box. All resorts are deselected.
- Select the individual resort, or resorts, whose data you want to include.
- To select multiple resorts, press and hold the Ctrl or Command key on the keyboard while clicking on a resort name.
As you select various resorts, the data on all three of the Deliverability dashboard sections update in real-time.
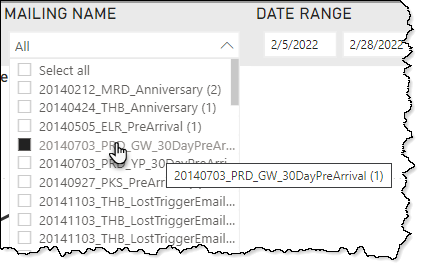
- In the Mailing Name drop-down list, all available mailings are pre-selected by default. To select one or more individual mailings to include in the data set:
- From the Mailing Name drop-down list, click the Select All box. All mailings are deselected.
- Select the individual mailing or mailings whose data you want to include.
- To select multiple mailings, press and hold the Ctrl or Command key on the keyboard while clicking on a mailing name. To view the full name of a mailing, hover your mouse pointer over the mailing name.
As you select various mailings, the data on all three of the Deliverability dashboard sections update in real-time.
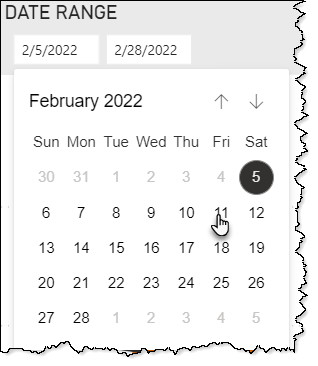
- In the Date Range fields, the prior 365 days are pre-selected by default. To change the date range, click on the start or end date fields and select a date from the calendar pop-up box.
As you select dates, the data on all three of the Deliverability dashboard sections update in real-time.
Note: Currently, data is available with a beginning date of February 5, 2022. The data displayed will span from February 5, 2022 up to the current date. Once 365 days of data is available, a rolling 365-days of data will be displayed.
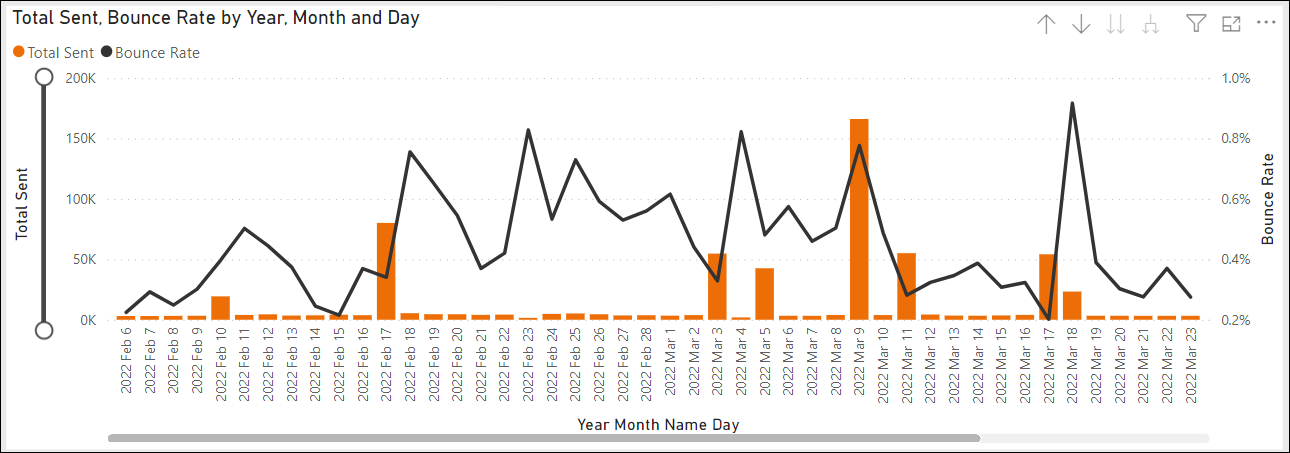
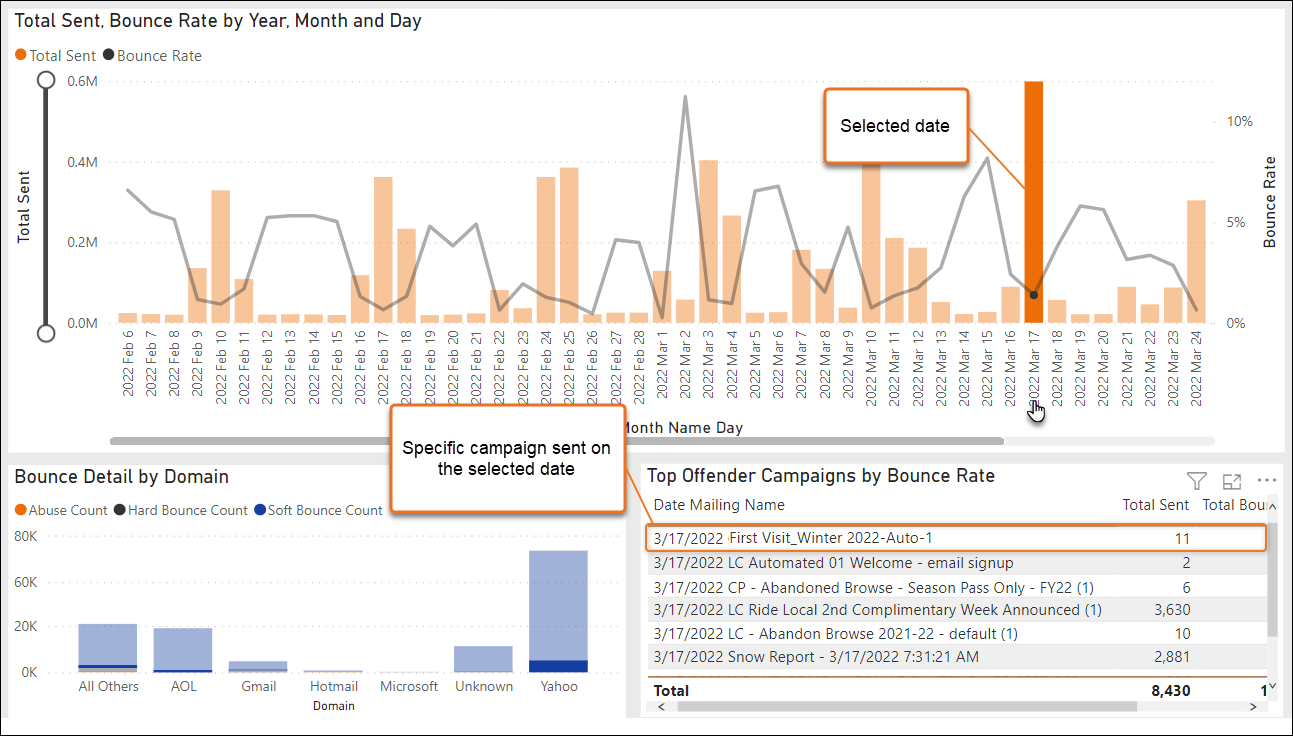
The Total Sent, Bounce Rate by Year, Month, and Day section provides a visual representation of the campaigns sent by date, providing a long-term view of the total number of sent emails and bounce rate. The view also shows abnormalities that require further investigation.
- Orange bars represent the total number of emails sent.
- Black line represents actual bounce rates.
- To view more date-specific information, interact with the chart.
- To increase or decrease the scale of total emails sent to narrow the campaigns to a specific number of sends, drag the circles on the Total Sent slider on the left side of the chart. For example, you can view the days you sent between 100,000 and 200,000 emails to see how they were affected.
- To view sent email counts or bounce rates for each date, hover your mouse over the orange bars or black line on the chart.
- Selecting a date updates all the other metrics on the dashboard for that date only.
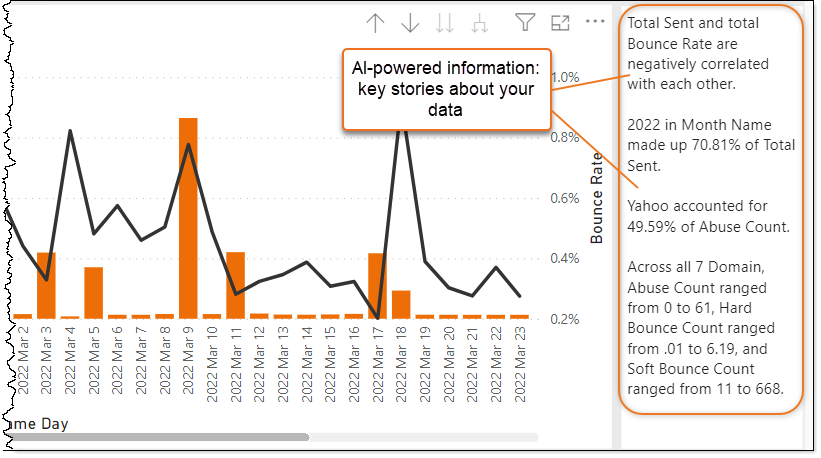
The AI-Powered Findings section to the right of the Total Sent, Bounce Rate by Year, Month, and Day section identifies key stories within your data and displays them in plainly worded sentences. The data is scanned using Microsoft Power BI™ technology to reveal key findings, thus eliminating the need for you to dig deeper into your data to uncover trends.
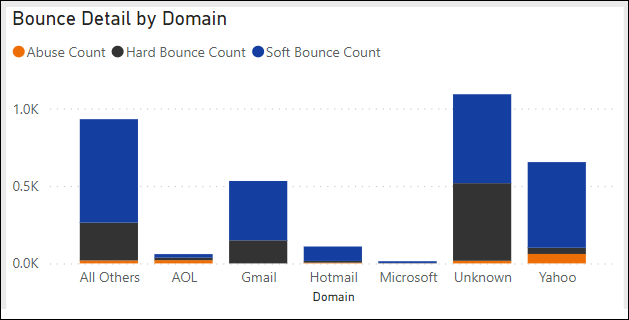
The Bounce Detail by Domain section provides a visual representation of which domains experienced the most bounces.
- Orange bars represent abuse counts.
- Black bars represent hard bounce counts.
- Blue bars represent soft bounce counts.
- To view abuse, hard bounce, or soft bounce counts, hover your mouse over the appropriate color-coded bar within the chart.
- To view more date-specific information, interact with the chart.
The Total Offender Campaigns by Bounce Rate table provides detailed metrics for specific mailings based on the Bounce Rate or Bounce Total.
The data defaults to Bounce Rate. To view Bounce Total, click the Bounce Rate/Bounce Total toggle.
The table displays the top offender campaigns based on the data selected in the Total Sent, Bounce Rate by Year, Month and Day section.
You can use the Deliverability dashboard to investigate why a specific campaign was problematic.
-
In the Total Sent, Bounce Rate by Year, Month and Day section, click on a date that requires further investigation. The selected data point is highlighted, and the remaining data points are dimmed. The metrics in the Top Offender Campaigns by Bounce Rate update.
-
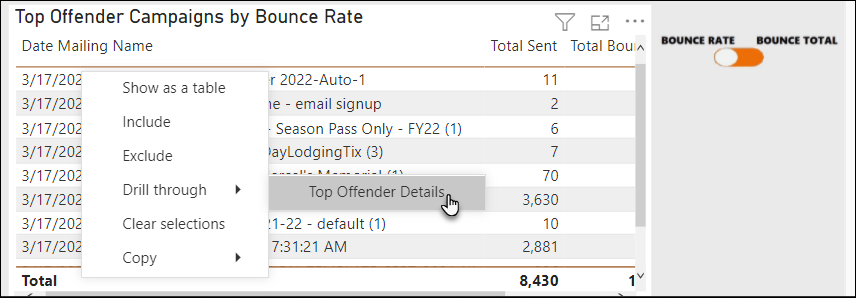
In the Top Offender Campaigns by Bounce Rate section, hover your mouse over the offending campaign, right-click, and from the menu, select Drill through – Top Offender Details.
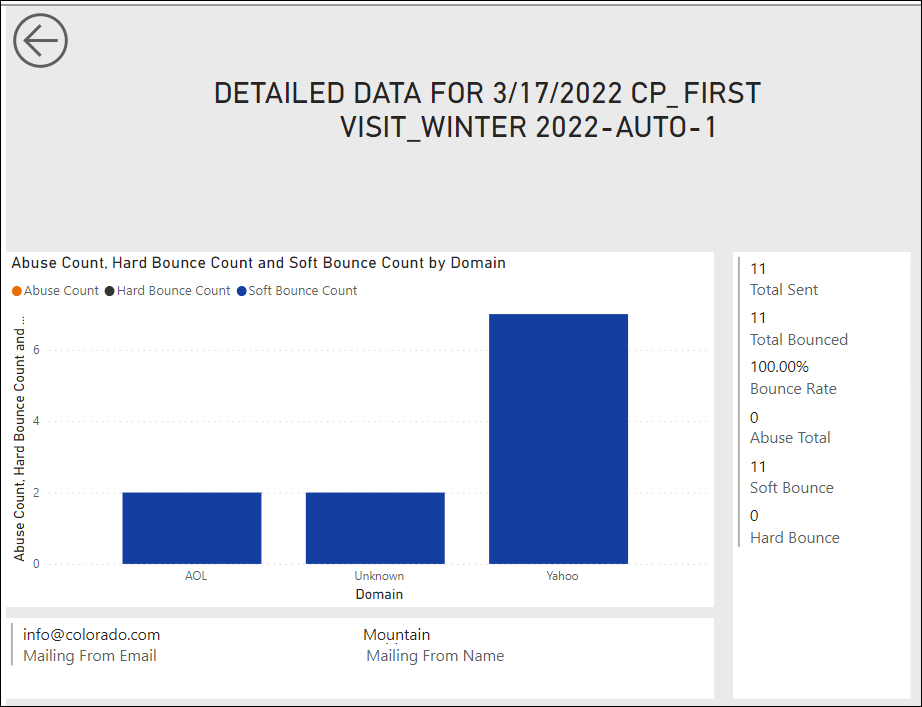
The Detailed Data for the <Campaign Name> screen appears.
The Detailed Data for the <Campaign Name> screen provides more information about the domains that encountered an issue, the mailing from email address and name, and the sent, bounced, and abuse counts for the email.
Some combination of the Microsoft Power BI® dashboard icons defined below appear in the upper right corners of the maps or individual charts on the Intelligence dashboards to further explore the data.
The dashboard icons available on each dashboard vary. Not all dashboard icons appear on every intelligence dashboard.
If the icons are not visible, click or hover your mouse on a map or chart.
You can export data from any Intelligence feature to a .csv or .xlsx file for further analysis. You can also export Intelligence data directly to a .pdf file. For more information and detailed instructions, visit Export Intelligence Data.
Note: For best results in exporting intelligence data, Inntopia suggests exporting to a .csv or .xlsx file.
The Inntopia Marketing Cloud platform uses Microsoft Power BI® to provide superior data analytics through visualization in its Intelligence reports. While this documentation makes every effort to provide an accurate representation of how to navigate and what you see on these visualizations, regular updates to the Power BI software by Microsoft may result in some variations in function and visuals in the reports. In addition, Microsoft Power BI recognizes how you use the application and caches your preferences, making your default view different from the images displayed in this documentation.
