Customer Reports
Customer reports detail the success rate of guest information captures.
Using a matrix to show how many families who visited in previous seasons (sets of consecutive years) returned to your resort during a later season, the Repeat Guest report helps you understand guest loyalty and patterns over time.
Conversely, the report also shows how many families who visited in later seasons were also at your resort during a prior season.
The report shows data from three seasons prior to the selected season.
For more targeted insights, you can select the season from which to look back and filter results to only include specific properties. .
Use the following parameters to run the report and filter report data:
- Season Id* – Seasonal time frame that spans two calendar years. The default winter dates are November 1 – April 30, and default summer dates are June 1 – September 30. Default season dates are configurable. For information on customizing season date ranges, contact your Strategic Account Manager.
- Destination* – Destination or resort name
- Property* – Property name
* = required parameter
- Year/Season – Year and six-month season (summer or winter)
- Number of Families – Number of families who visited during each year/season
- Family Count – Number of families who visited during each year/season
- Avg Spend ($) – Average dollar amount spent per family during each year/season
- % Return – Percentage of families who returned from previous season
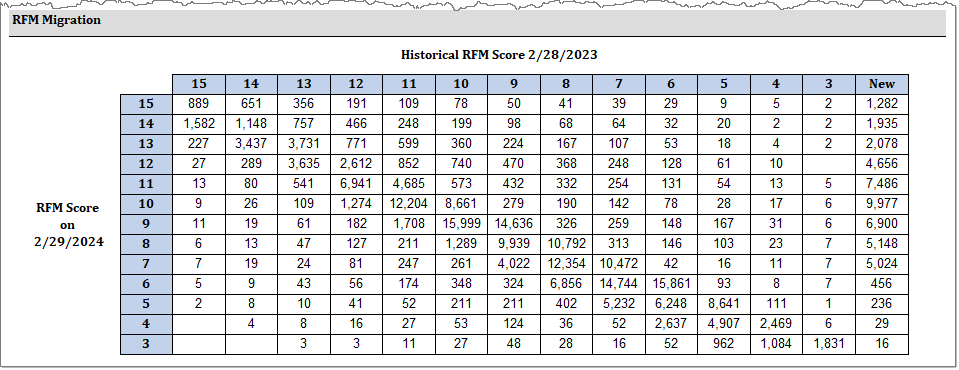
By comparing the Recency-Frequency-Monetary Scores (RFM) of all customers in your base on two specified dates, the RFM Score Card report depicts the evolution of your customers' RFM Scores.
The first part of the report shows a total customer count per RFM Score for each selected date. The report also includes the percentage growth between these two dates for each RFM score included in this report to give you insights into how customers are trending from the beginning to the end of a single season such as shifts in customer engagement and spending.
The second part of the report shows the migration from the Compare Date to the Score Date.
Use the following parameters to run the report and filter report data:
- Score Date* – Date stamp of RFM scores. RFM scores can change for a family over time, so the RFM Score Date allows you review past RFM Score data. RFM date stamps are recorded in the database every three to six months.
- Compare Score Date* – Date to which you want to compare the Score Date
* = required parameter
- RFM Score – Recency-Frequency-Monetary Score (ranges from 3 –15)
- Compare Score Date (Date 1) – Number of customers representing each score for the comparison period
- Score Date (Date 2) – Number of customers representing the base date period
- % Growth) – Percentage growth between the Compare Date and the Score Date
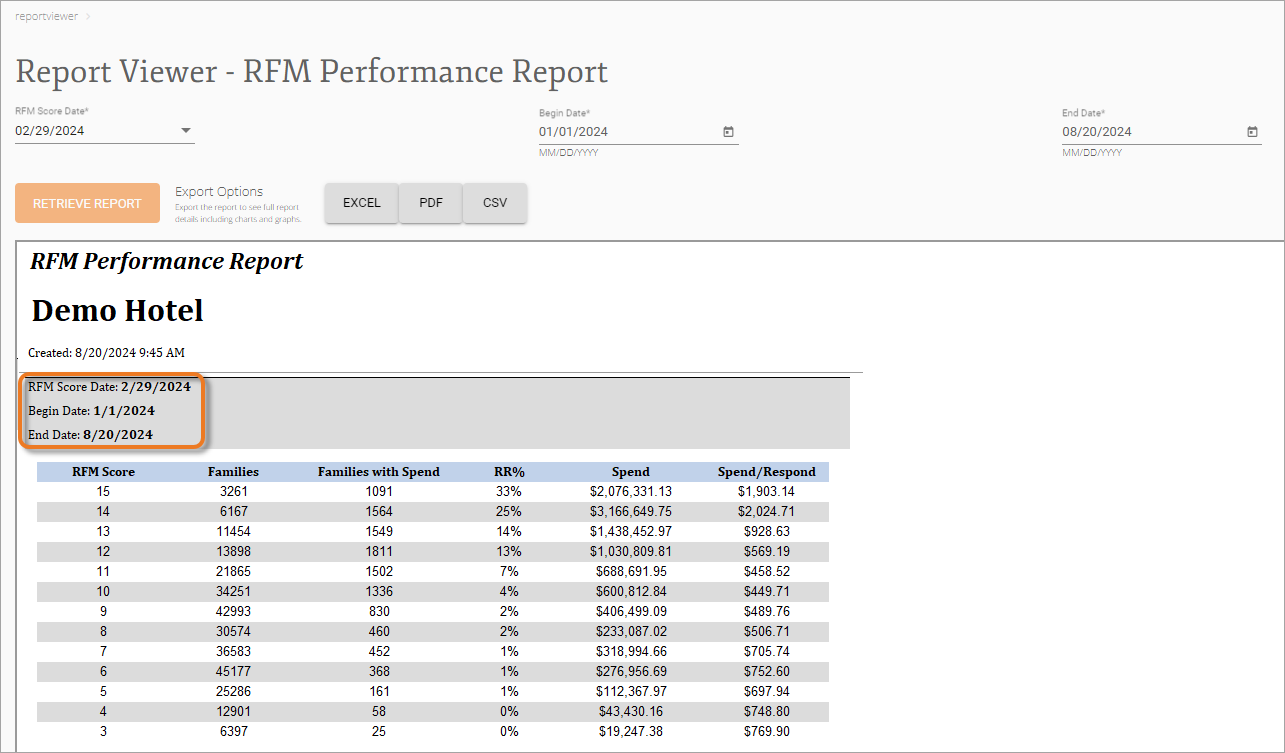
The RFM Performance Report analyzes customer behavior and spending habits over a designated period to help you tailor marketing strategies, reward loyal families, and identify re-engagement opportunities.
The report shows how many Family Keys (a unique family identifier assigned by Inntopia) held a particular Recency-Frequency-Monetary Score (RFM) on a specified date. It also shows how much money was spent by those families during a specific date range.
Note: The Family Key assigned by Inntopia links household members. You can see who is linked together as a family on the Household Members tab on the Customer Profile.
Use the following parameters to run the report and filter report data:
- RFM Score Date* – Seasonal date stamp of RFM scores. RFM scores can change for a family over time, so the RFM Score Date lets you review past RFM score data. RFM date stamps are recorded in the database every three to six months.
- Begin Date* – First day of the date range for the report
- End Date* – Last day of the date range for the report
* = required parameter
- RFM Score – Recency-Frequency-Monetary Score (ranges from 3 – 15)
- Families– Number of families with the corresponding RFM Score
- Families with Spend – Number of families who spent money during the selected date range
- RR% – Return Rate Percentage. Number of families who returned to the property and spent money. Calculated by Families divided by Families with Spend.
- Spend ($) – Total dollar amount spent by all families
- Spend/Respond ($) – Average dollar amount spent per family (Spend divided by Families with Spend)
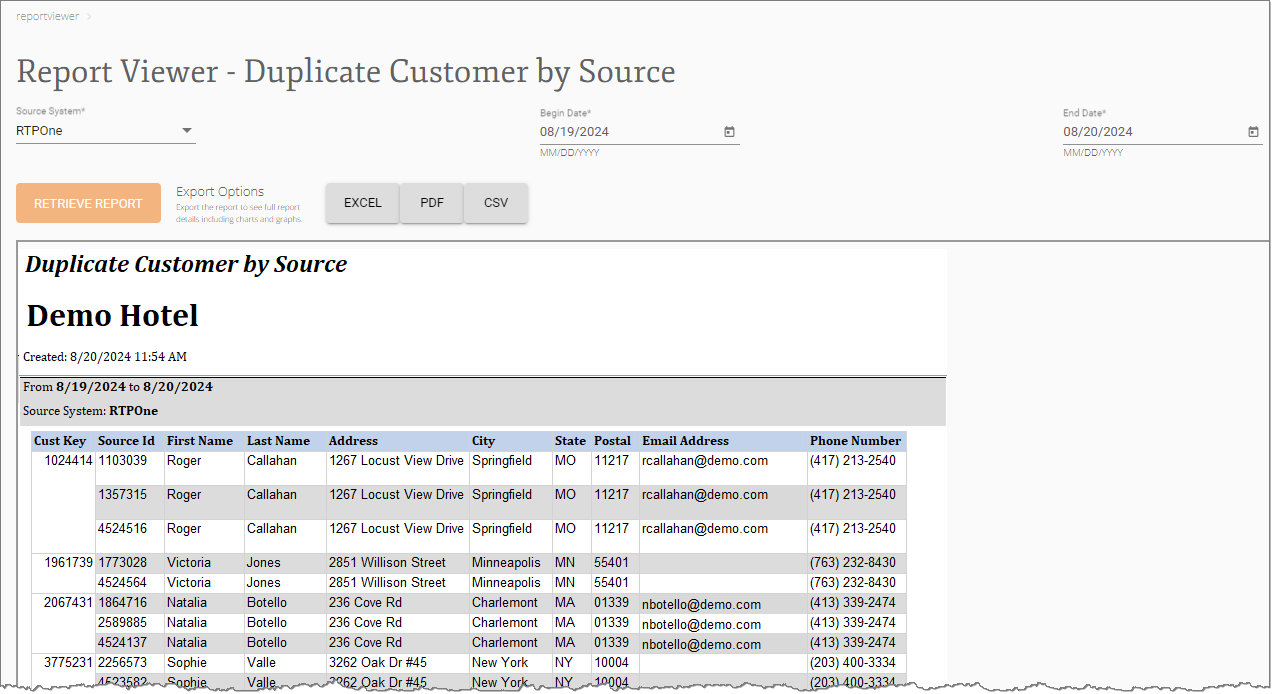
The Duplicate Customer by Source report helps you identify and manage duplicate customer records, and plan for clean-up or process improvements in source systems.
This report shows the Customer Key (a unique identifier assigned by Inntopia), Source Id, and personal information for customers who had duplicate data imports from a source system during a specified date range. You can filter the report to only include specific source systems.
If a duplicate customer is identified in this report, Inntopia Marketing Cloud has matched and merged these customers into a single profile, so no further action is needed.
Use the following parameters to run the report and filter report data:
- Source System* – Source system of the imported and integrated data
- Begin Date* – First day of the date range for the report
- End Date* – Last day of the date range for the report
* = required parameter
- Cust Key – Customer Key number unique to Marketing Cloud
- Source Id– Original source customer number
- First Name– Guest first name
- Last Name– Guest last name
- Address – Guest street address
- City – Guest city
- State – Guest state
- Postal – Guest postal code
- Email Address – Guest email address
- Phone Number – Guest phone number


