Pass Reports
The Marketing Cloud Insight portal provides multiple pass-related reports and a worksheet that provide valuable insight into pass sales and demographics. You can organize your pass products into groups to better track your pass sales.
- Pass grouping is a way to easily categorize your pass products and to see trends for your resort's various levels of pass access such as pass upgrades or downgrades, renewal or lapsed rates, new vs existing pass holders, etc.
- Pass grouping categories and names are determined by you, the partner, and then set up in your Marketing Cloud account by Inntopia staff.
- Pass products are assigned, or mapped, to their designated pass groupings by Inntopia staff.
- Pass grouping determines which passes are included in the data of all Marketing Cloud pass reports.
- Employee, complimentary, and industry pass types are typically not included in pass reporting; therefore, you may not want to map these types of pass products to a pass grouping.
- When considering how to best determine groupings for your resort's passes, Inntopia suggests thinking about how your resort tracks and categorizes types of passes, and how you want to view metrics for unit, revenue, sales, retention, and migration.
- If you have a dedicated Inntopia Account Manager and need assistance determining appropriate sets of pass groupings and rules for your resort, schedule a strategic working session with your Account Manager.
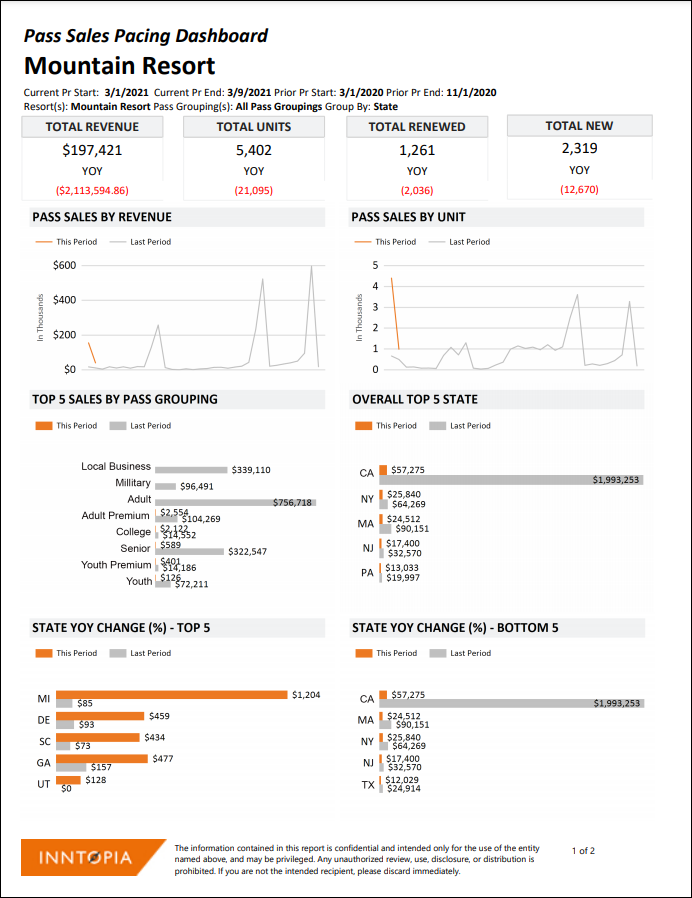
The Pass Pace Dashboard shows current pass sales and compares them to the previous year’s sales. The dashboard analyzes total revenue and units sold, and breaks down the data by age range, county, metropolitan statistical area (MSA), pass grouping, or state.
- Log into Inntopia Marketing Cloud and from the left menu, click Reports. The Reports menu expands.
- From the Reports menu, click Pass. The Pass menu expands.
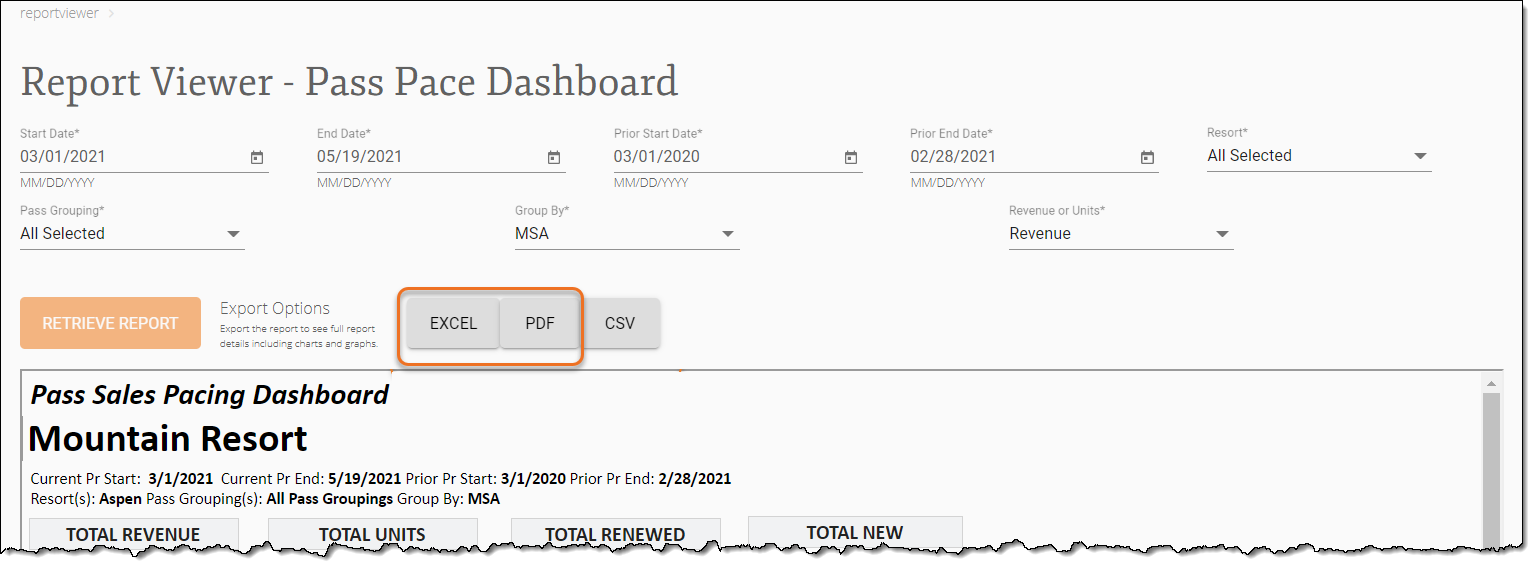
- From the Pass menu, click Pass Pace Dashboard. The Report Viewer – Pass Pace Dashboard screen appears.
- To determine the dashboard parameters for data display:
- In the Start Date and End Date filters, determine the date range for the data set.
- In the Prior Start Date and Prior End Date filters, determine the year-over-year (YOY) comparison date range.
- If you are part of a multi-resort group and have access to view multiple properties, in the Propertyfilter, select which properties to include in the data set.
- In the Pass Grouping filter, determine which passes should be included in the output. (By default, all pass groupings are selected.)
- In the Group By filter, determine how the data should be sorted within the dashboard by selecting one of the following: Age Range, County, MSA, Pass Grouping, Resort, or State. (By default, MSA is selected.)
- To generate the dashboard, click Retrieve Report.
A preview of the Pass Pace Dashboard appears with limited data.
-
To view the complete dashboard data, click either the Excel or PDF button to export the dashboard.
From your browser, download and open the file.
Note: If the file opens in a read-only format, enable editing to use the file.
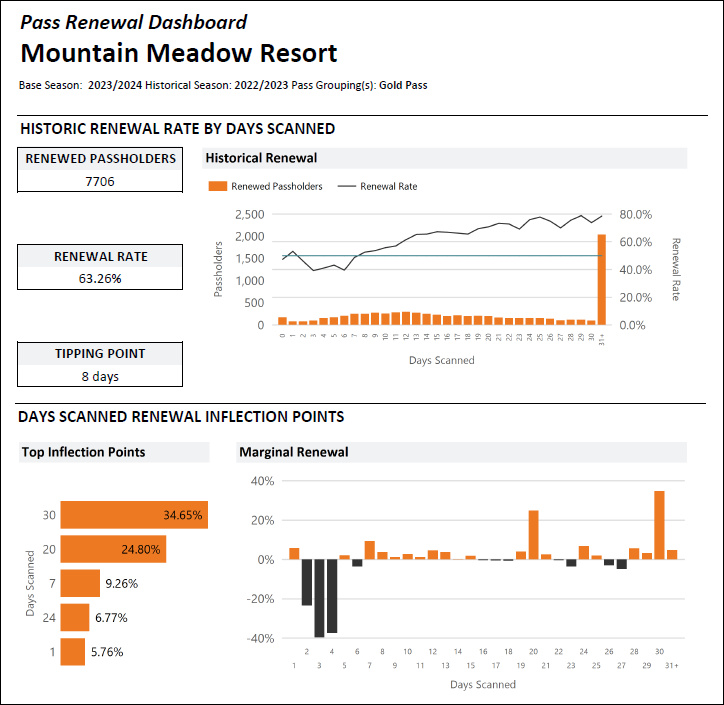
The Pass Renewal Dashboard shows the connections between the number of days a pass is scanned and pass renewal rates. Generally, the more days a pass is scanned, the higher the likelihood a pass holder will renew their pass the following year.
The Pass Renewal Dashboard shows you:
- The number of days a pass is scanned relative to the likelihood a pass holder will renew,
- Inflection points that have an outsized impact on renewal rates, and
- Pass renewal pace comparisons by year.
The Pass Renewal Dashboard lets you review pass renewal metrics for a specific pass grouping (i.e. pass holders who currently have a Gold Pass and renewed a Gold Pass). The following terms are used within the dashboard:
- Base Year – Year to compare to for pacing. Typically the current year.
- Historical Year – Year used to compare pass renewal behavior. Typically the previous year; however, you can select other years to account for abnormalities in visitation behavior, such as unusual weather or a pandemic. Also the year used to calculate Renewal Rate and Tipping Point.
- Renewal Rate – Percentage value calculated by Renewed Pass holders divided by Total Pass holders in the Selected Pass Grouping(s). Based on the season selected as the Historical Year.
- Tipping Point - Number of days scanned at which the subsequent renewal rate exceeds 50%. Based on the season selected as the Historical Year.
Note: Tipping Point ignores days scanned when the number of days is fewer than two.
- Inflection Point – Additional scanned days that have an oversized impact on renewal rates. For example, pass holders who have seven scans might be 15% more likely to renew after eight scans.
- TWLY – Acronym for This Week Last Year.
- Log into Inntopia Marketing Cloud and from the left menu, click Reports. The Reports menu expands.
- From the Reports menu, click Pass. The Pass menu expands.
- From the Pass menu, click Pass Renewal Dashboard. The Report Viewer – Pass Renewal Dashboard screen appears showing the Base Year and Historical Year drop-down lists.
- To select the dashboard parameters for data display:
- From the Base Year drop-down list, select the year you want to compare for pacing.
- From the Historical Year drop-down list, select the year to which you want to compare behavioral patterns. The Pass Grouping drop-down list appears.
- From the Pass Grouping drop-down list, select the pass(s) to include in the data set.
- To generate the dashboard, click Retrieve Report.
A preview of the Pass Renewal Dashboard appears with limited data.
- To view the complete dashboard data, click either the Excel or PDF button to export the dashboard.
From your browser, download and open the file.
Note: If the file opens in a read-only format, enable editing to use the file.
The Historic Renewal Rate by Days Scanned section displays an historical baseline for pass renewal behavior. The date range is determined by the Historical Year selected within the report parameters. You can change the historical season to account for behavioral abnormalities due to weather, snowfall, or visitation. You can select various pass types to see how behavior changes across different product offerings.
The Days Scanned Renewal Inflection Points section shows the differences in renewal rate for each additional day scanned (for example, the change in renewal rate when a pass holder goes from six days scanned to seven). The Top Inflection Points chart shows the top five days with the highest increase in renewal rates. This can be used to create automated triggers for marketing campaigns encouraging pass holders to get to the next key milestone and improve overall chances of renewal.
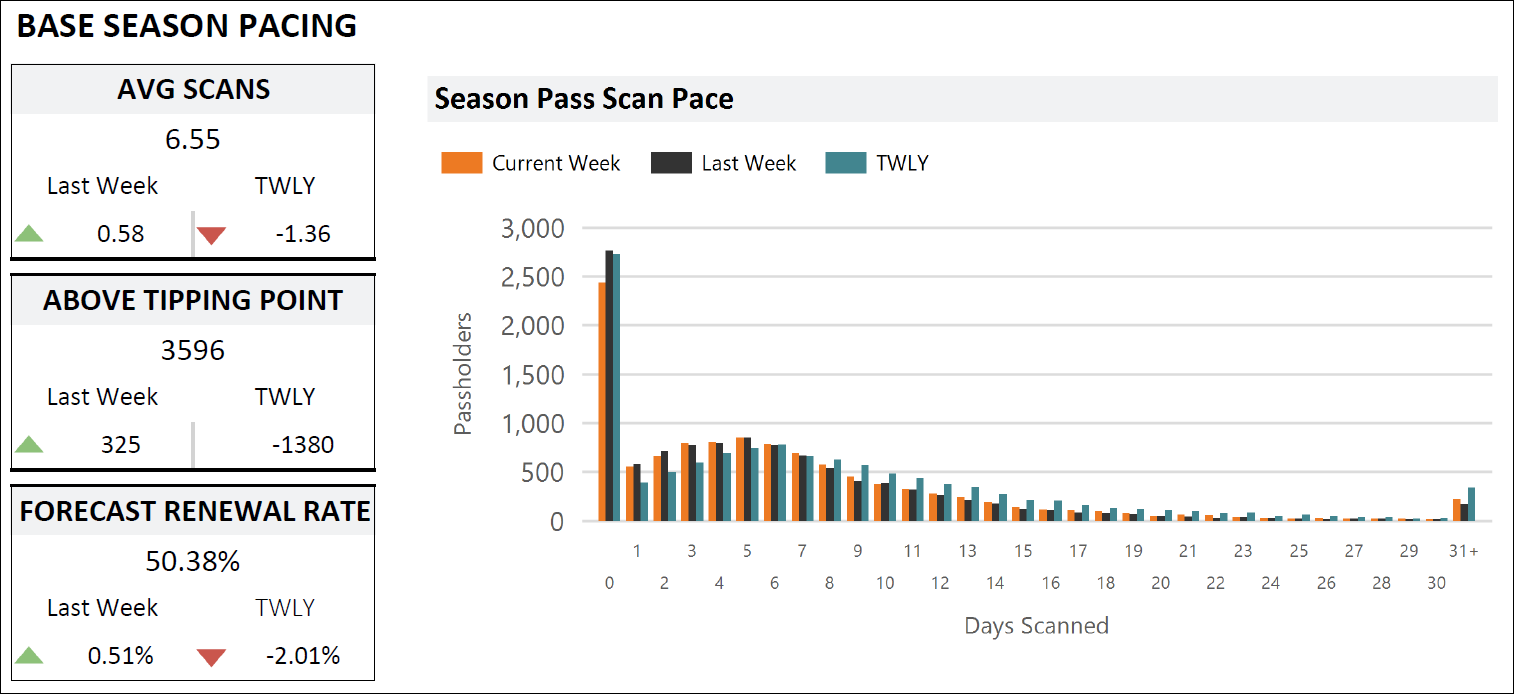
The Base Season Pacing section shows the number of days scanned for the current season and uses the information established in the previous historical season to create a forecast for pass renewal. The Season Pass Scan Pace chart displays the average number of scans for pass holders as of this week and compares it to last week and this week last year (TWLY).
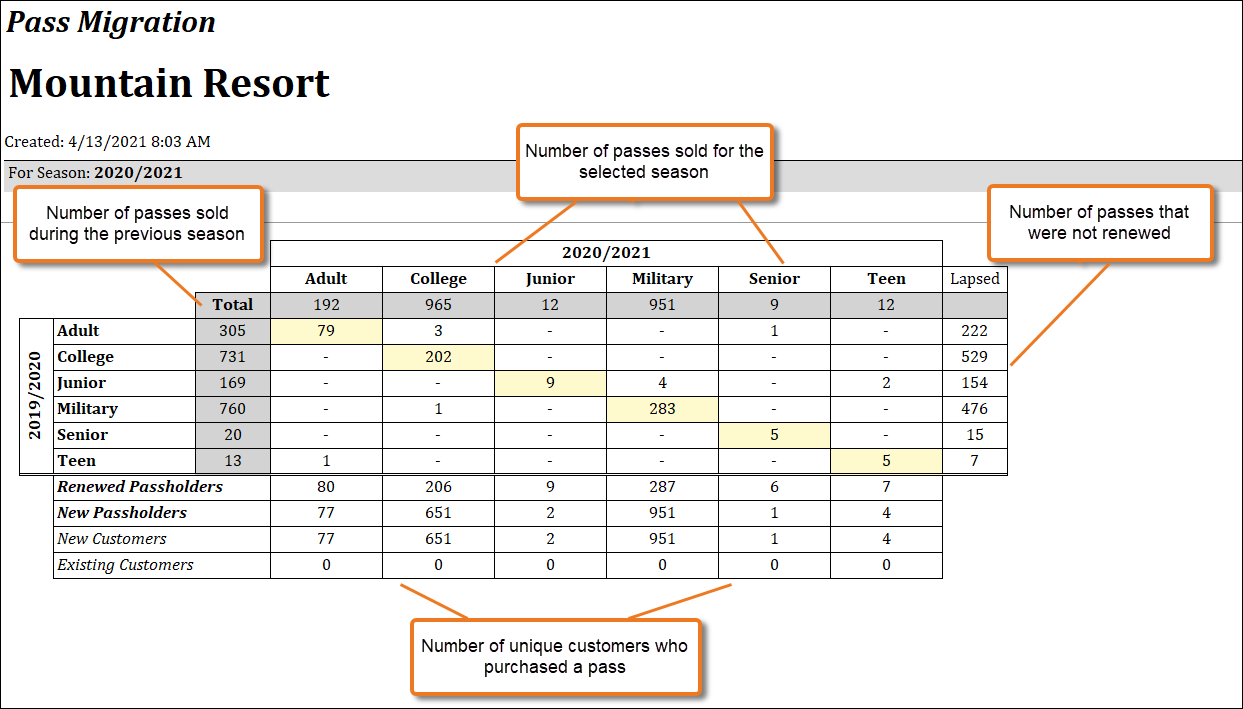
The Pass Migration report is a forward-looking-only report for viewing renewal status, or lack thereof, of your season pass products. The report provides a matrix view of prior season pass sales and pass migration for the selected season.
The top section of the matrix shows the number of pass products sold. The lower section of the matrix shows the number of unique customer records. The numbers between each section may not add up because customers can purchase more than one pass; however, each individual customer cannot account for more than one customer record.
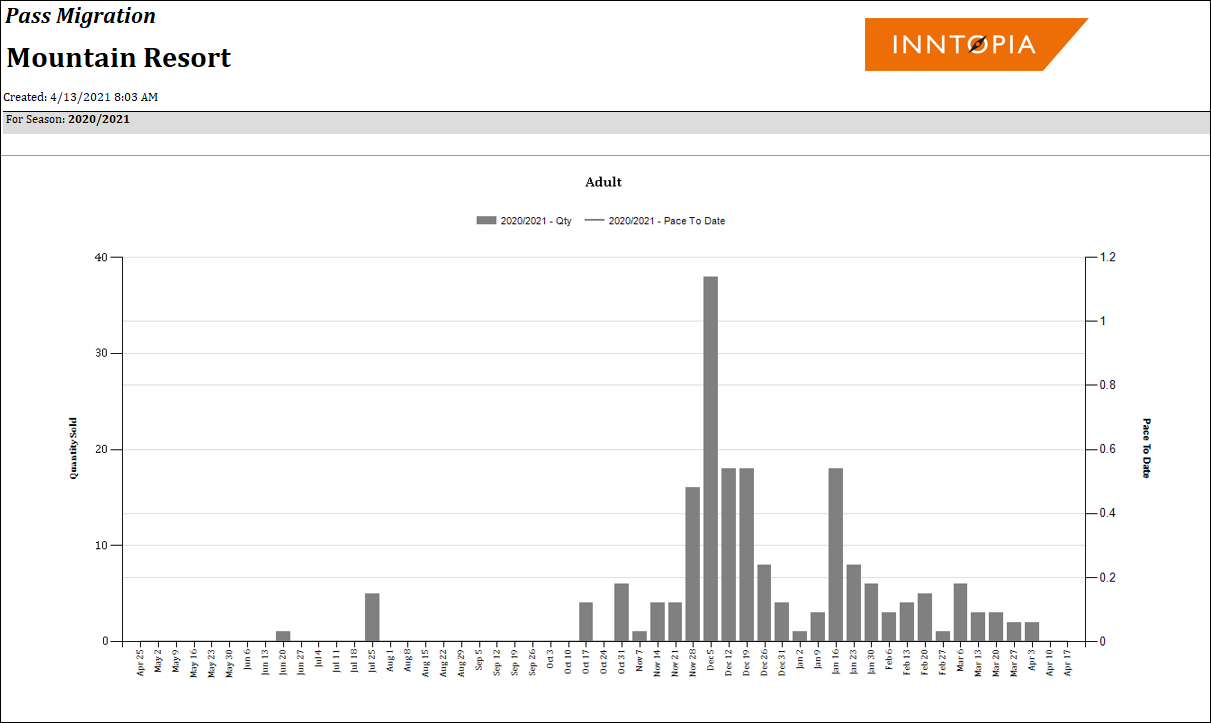
Additional charts that break down pass sales by pass grouping are available on subsequent pages of the report. The charts show Quantity Sold (per week) and Pace to Date (if applicable year-over-year for the selected time frame) for the selected season.
Note: For backward-looking season pass renewal trends such as what percent of current season pass holders are new verses renewing, view the Intelligence: Pass Migration feature.
Use the following parameters to run the report and filter report data:
- Season ID – Season for which you want to generate the report
- Resort – If you are part of a multi-resort group and have access to view multiple properties, select which properties to include in the report. All resorts are selected by default.
* = required parameter
The Pass Sales – Goal Tracker Report lets you compare current pass sales with a previous period (one, two, or three years ago). The report relies on pass products being assigned to the proper Pass Grouping. To confirm your Pass Grouping configuration is complete, review the Pass Migration Worksheet.
You can export the report to an .xlsx, .pdf, or .csv file.
The top half of the Pass Sales – Goal Tracker report shows the sales revenue goal and the bottom half shows unit sales goal.
Use the following parameters to run the report and filter report data:
- Sales Start Date* – First day of the date range of current pass sales to compare on the report.
- Sales End Date* – Last day of the date range of current pass sales to compare on the report. Can be in the future and commonly includes the end of a pricing deadline or the last date passes are available for purchase.
- Resort* – If part of a multi-resort configuration, select which resort(s) to include in the report.
- Pass Grouping* – Select one or more individual pass groupings to include in the report.
- Goal Deadline* – Enter the desired date for the goal to be met. This date can be the same or different from the Sales End Date.
- Unit Goal* – Enter the total number of passes the resort expects to sell for the selected pass grouping(s).
- Revenue Goal* – Enter the total amount of revenue the resort expects to earn for the selected pass grouping(s).
- Compared To* – Select the year to which you want to compare current pass sales: Prior Year, 2 Years Ago, or 3 Years Ago.
* = required parameter
- Progress to Goal – Percentage of the entire goal amount of passes sold to date
- Days Remaining – Days until goal deadline
- Sales / Day to Goal – Dollar amount of sales needed on each remaining day to reach sales goal
- Pace Momentum – Shows the increase or decrease in the pace of sales (in units and revenue) over the prior two-week period as compared to the pace of the same two weeks of the prior year. An increase in momentum indicates a faster sales pace than the prior year (gaining ground); a decrease in momentum indicates a slower pace than the prior year (losing ground).
For example, if sales decreased as compared to the pace of sales from the prior year, this field shows a negative number which represents losing momentum. If sales increased, the field shows a positive number which represents gaining momentum on the pace of sales from the prior year. A zero in this field means the pace of sales equals the pace for the same two-week period in the prior year (i.e. the momentum neither increased or decreased).
- Units / Day to Goal – Total number of pass sales needed on each remaining day to reach sales goal
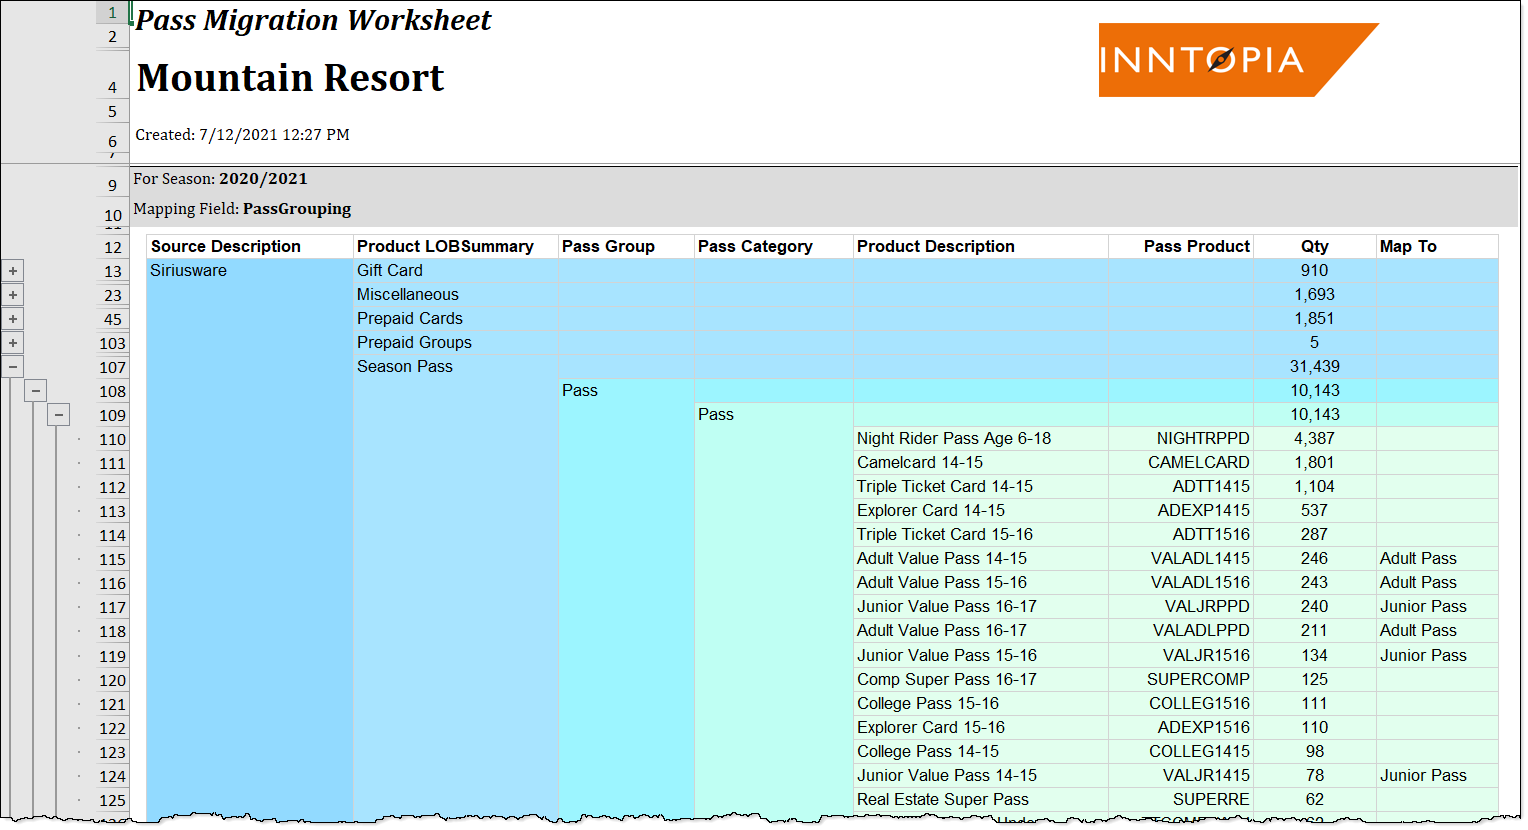
The Pass Migration Worksheet is a formatted Microsoft® Excel spreadsheet populated with data from your Point-of-Sale (POS) system that is used by both you and Inntopia staff to assist in troubleshooting and to communicate about Pass Groupings structure.
You can review pass products, indicate to which pass groupings (either existing or new) individual pass products must be mapped, and verify that previously-mapped pass products are assigned to the correct pass grouping. Once completed, you can submit the Pass Migration Worksheet to Inntopia staff who assign the pass products to their designated pass grouping and/or make any necessary updates to your existing pass grouping assignments.
The data in the worksheet columns is defined by how your products are set up in your POS system.
Pass Grouping is a configurable field in the Inntopia Marketing Cloud Passes table that Inntopia staff uses to map individual pass products to a larger category for reporting purposes.
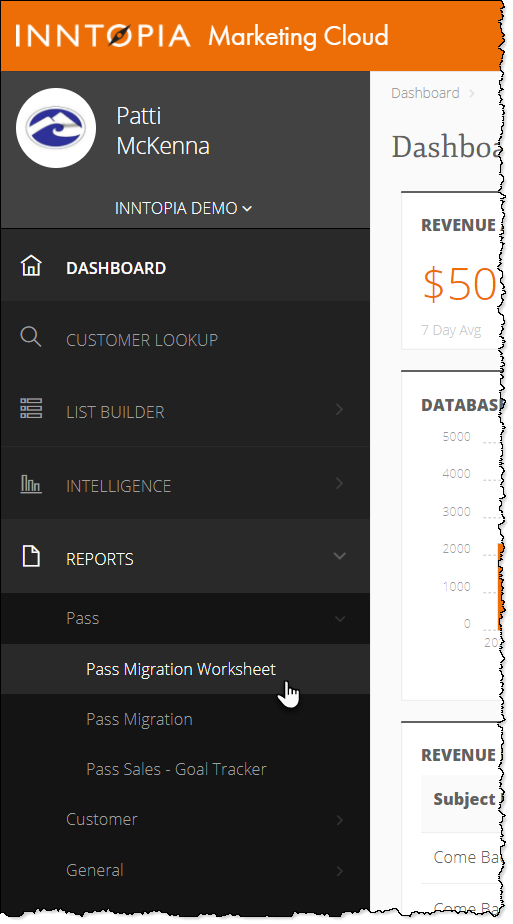
- Log into Inntopia Marketing Cloud and from the left menu, click Reports. The Reports menu expands.
- From the Reports menu, click Pass. The Pass menu expands.
- From the Pass menu, click Pass Migration Worksheet.
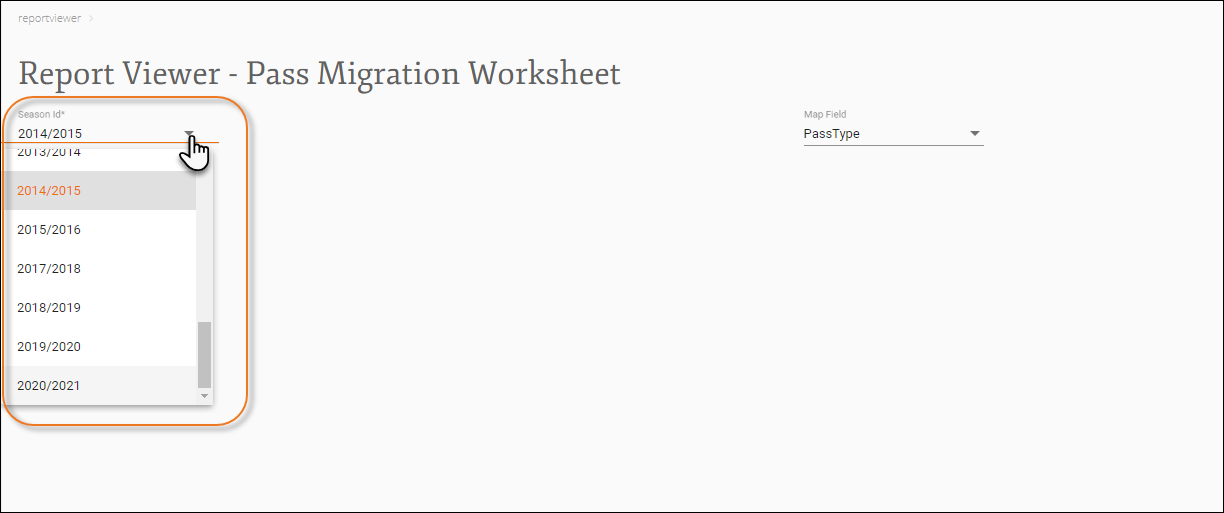
The Report Viewer – Pass Migration Worksheet screen appears.
-
From the Season ID drop-down list, select the season for which you want to open the worksheet.
-
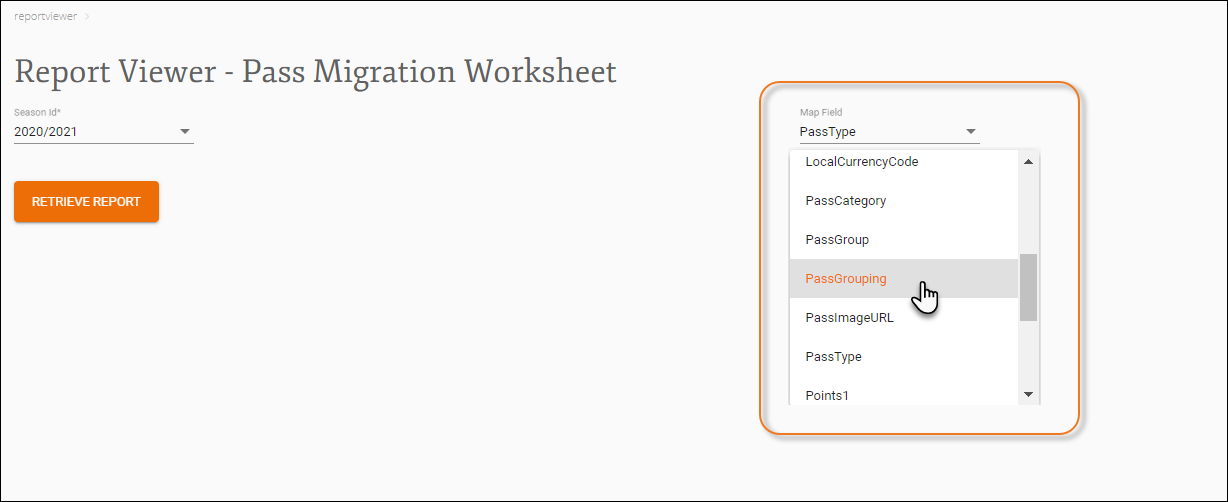
From the Map Field drop-down list, select PassGrouping.
Note: Other options with names similar to PassGrouping may be listed. Be sure to select the correct option.
-
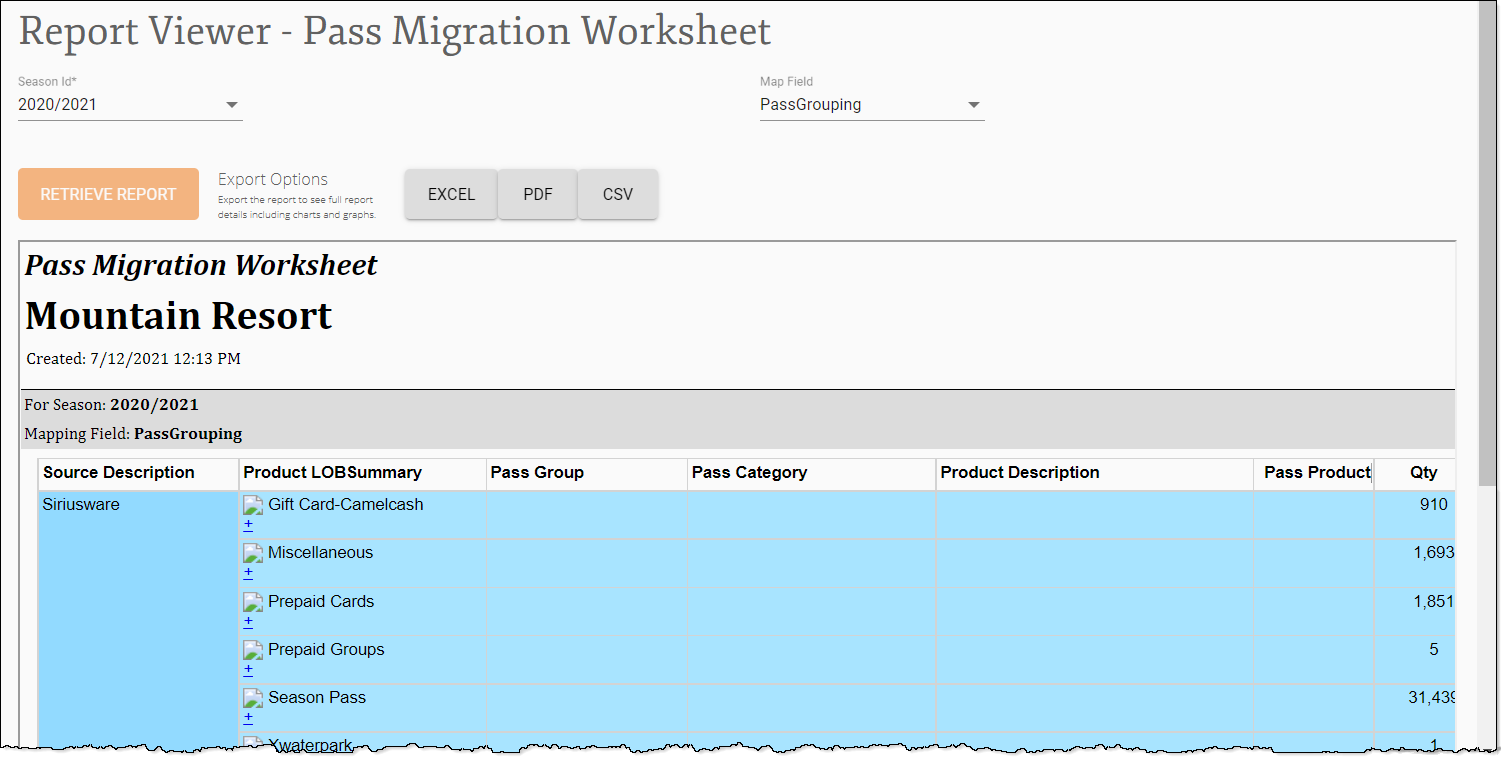
Click Retrieve Report.
A preview of the Pass Migration Worksheet appears. (This preview is not an editable version of the worksheet.)
-
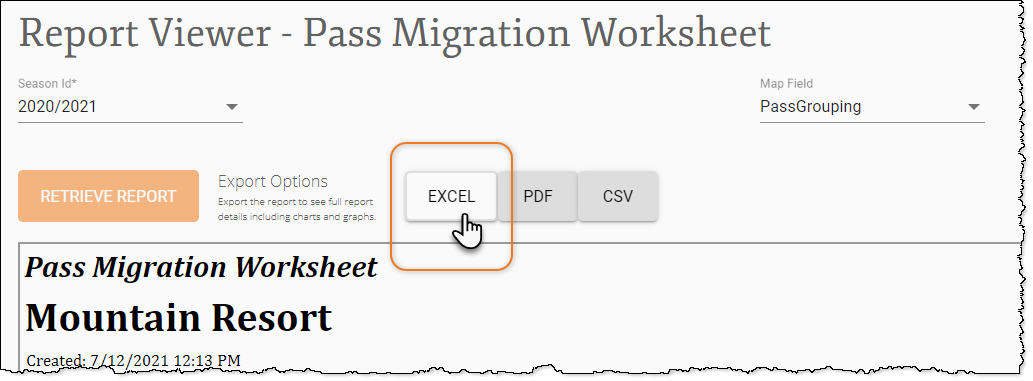
To open the worksheet, click the Excel button and then download and open the file.
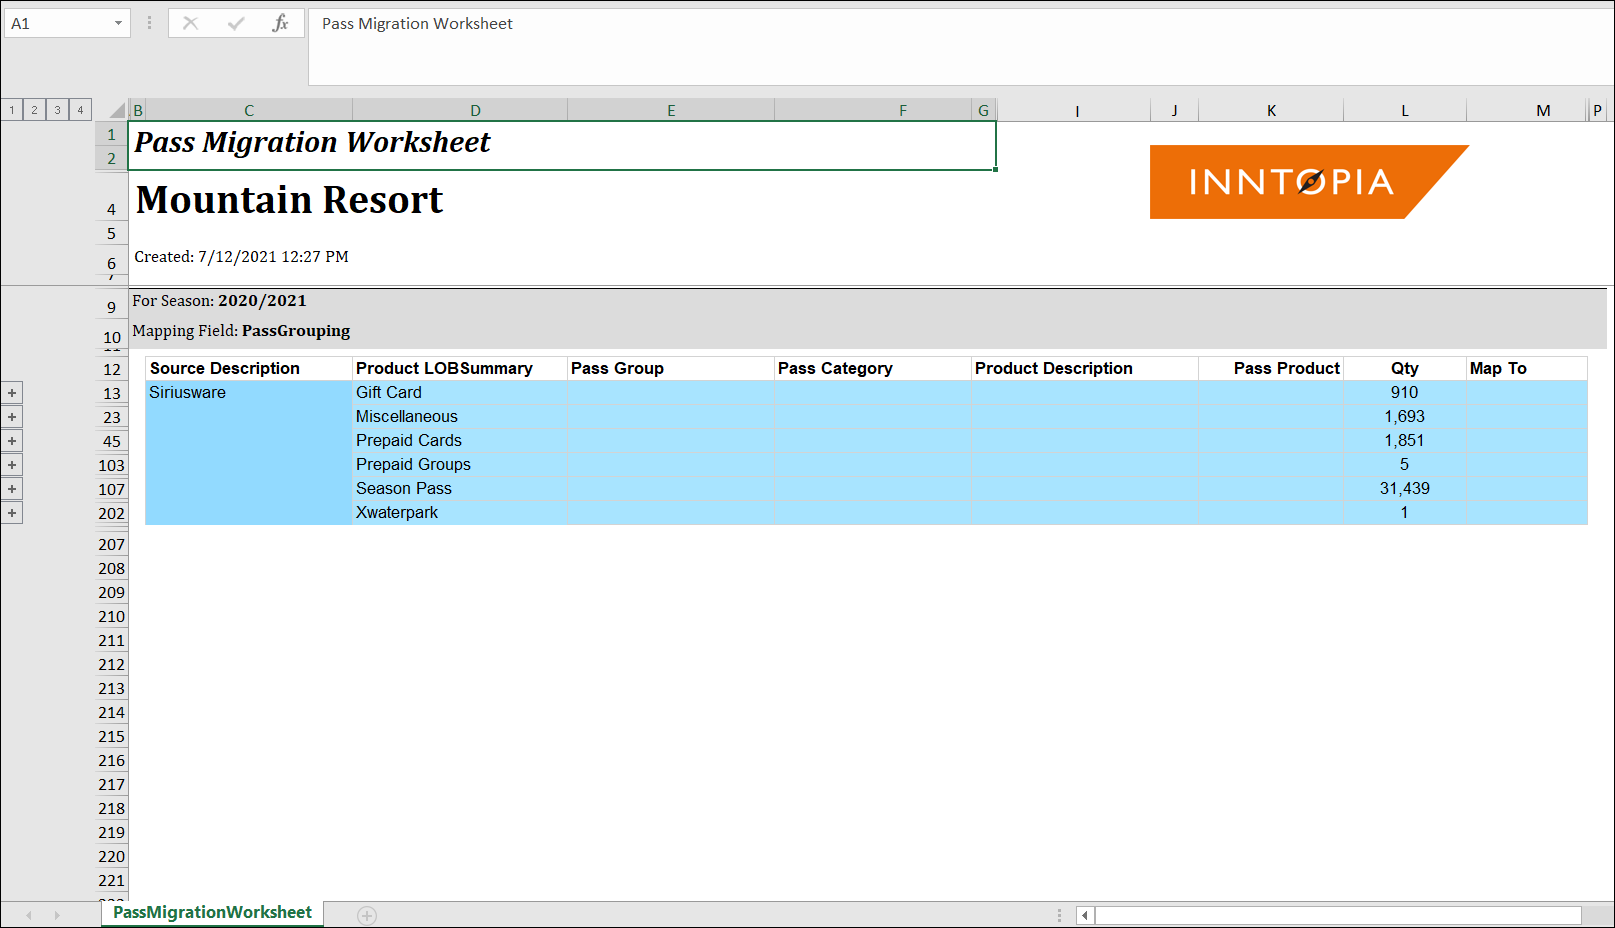
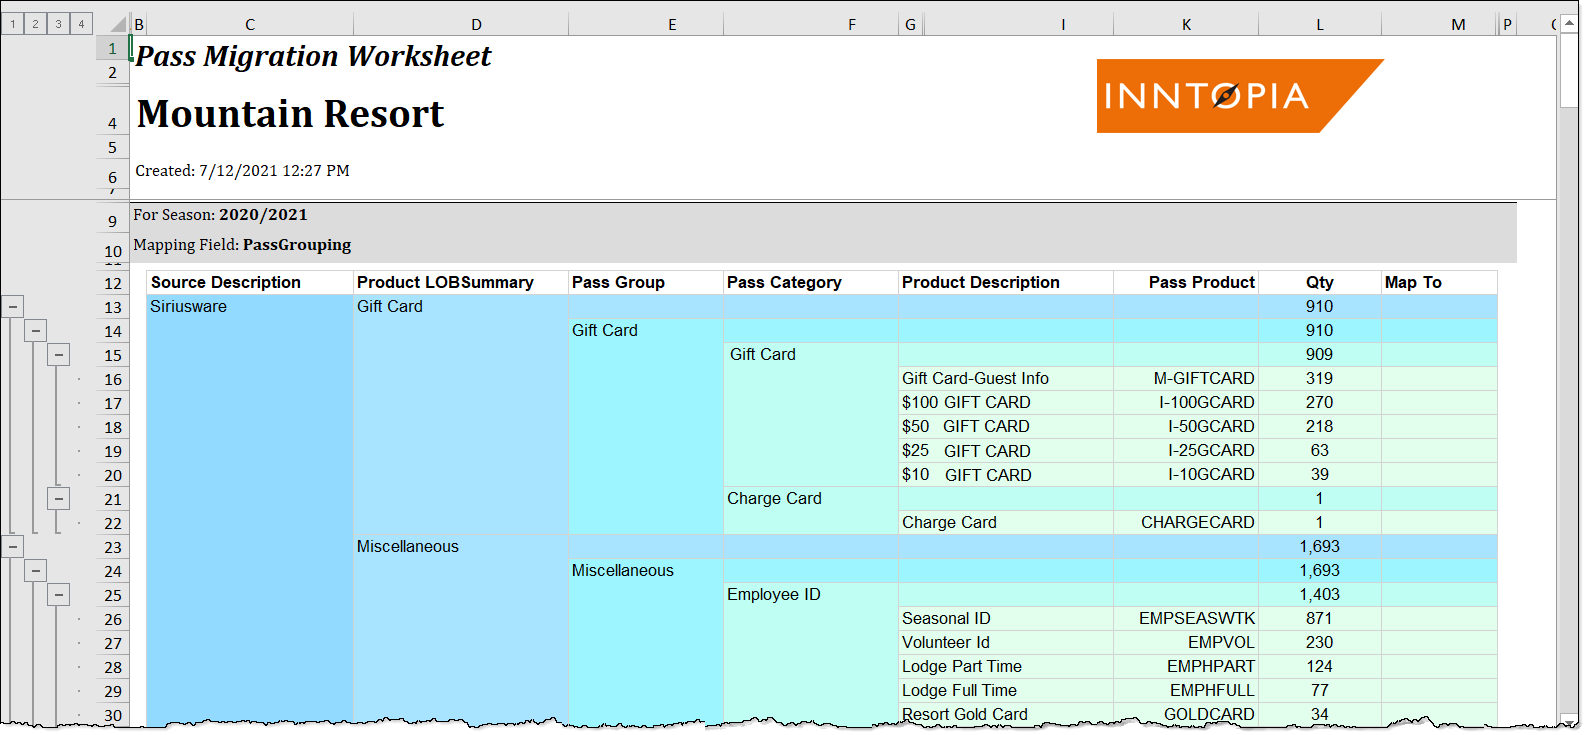
The worksheet appears showing data in the Source Description, Product LOB Summary, and Qty columns.
The data in the worksheet columns is determined by how your products are set up in your POS system. The Map To column indicates to which pass grouping the pass product is or should be mapped.
Notes:- The worksheet cannot be accessed via the PDF or CSV buttons.
- If the .xlsx file opens in a read-only format or protected view, enable editing to use the file.
- The names appearing in the column fields on the worksheet represent information specific to your resort and may not exactly match what you see in the example screen shots in this document.
You can expand and collapse rows in the worksheet to reveal and review data, and make necessary mapping changes.
- Inntopia recommends working with individual rows on the worksheet; however, you can expand all rows in the worksheet simultaneously to reveal all available data for all products.
- Typically, only the newest season passes need mapping.
- You can either use existing pass groupings if still applicable or indicate new pass grouping values that need to be added to your pass data set.
- Open the Pass Migration Worksheet.
- To expand all rows and reveal all existing column data:
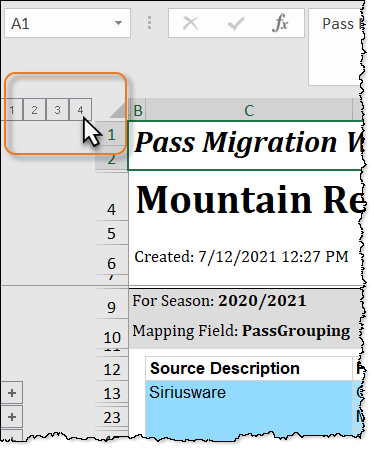
- On the upper left corner of the worksheet, click the 4 button. All rows in the worksheet expand to reveal data in all columns. Depending on your resort's pass grouping setup, the Map To column data may be completely configured, partially configured, or fully in need of configuration.
- Continue to Step 4.
- To expand and work within a single row:
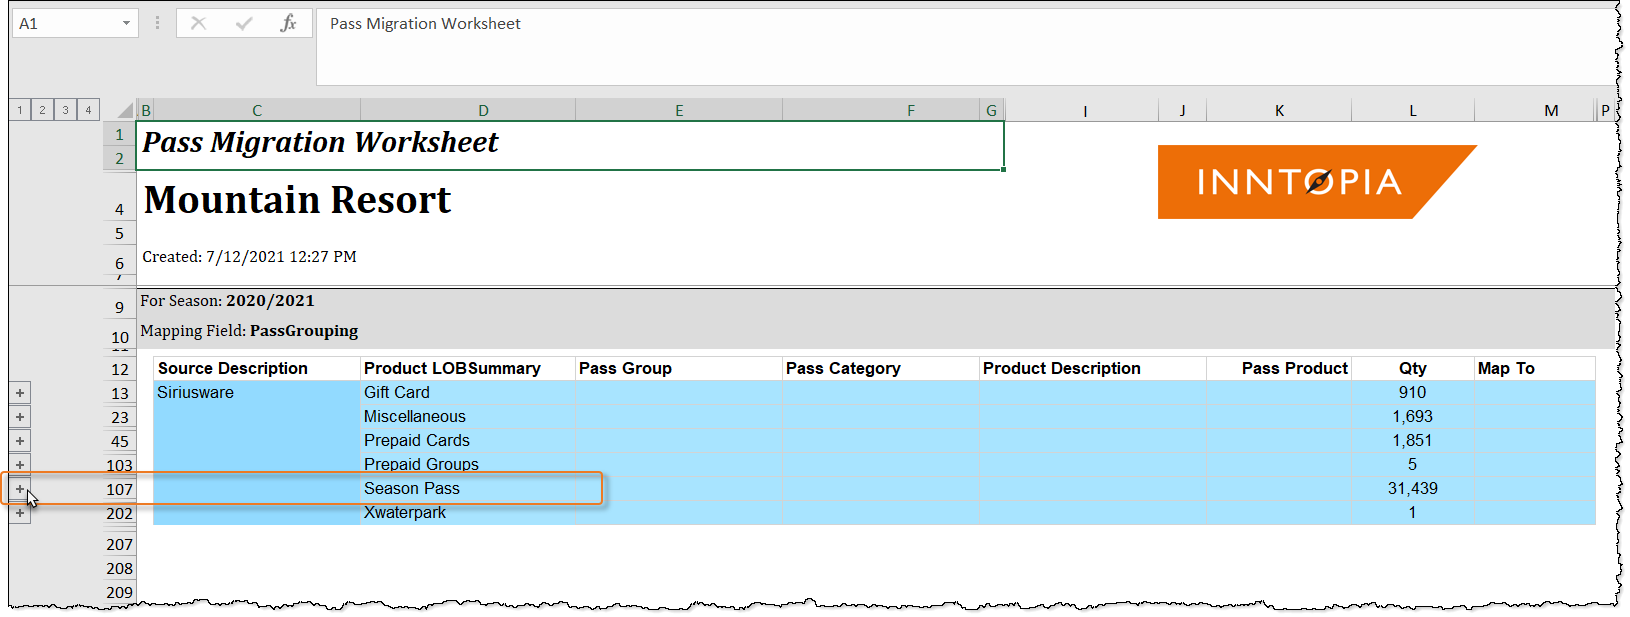
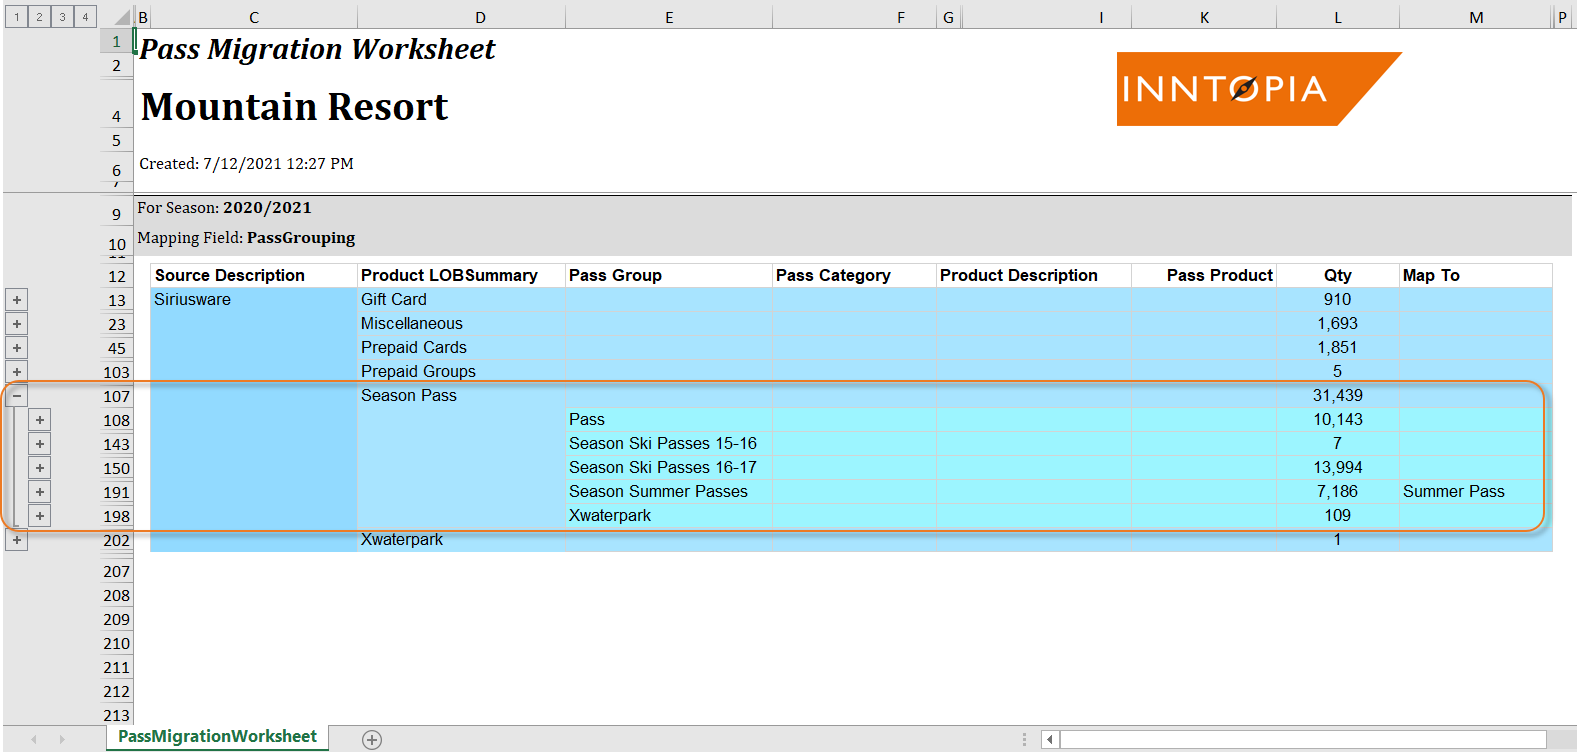
- In the Product LOB Summary column, find the row you want to work with and, on the left side of the worksheet, click its corresponding + button. The row expands and the names of all pass groups associated with the expanded product appear in the Pass Group column.
- In the Pass Group column, find the row containing the pass group you want to work with and, on the left side of the worksheet, click its corresponding + button. All pass categories associated with that pass group appear listed in the Pass Category column.
- Further expand the row with which you are working by clicking the next level + button until data appears in the Product Description, Pass Product, and Map To columns. If the pass product with which you are working has previously been mapped to a pass grouping, that pass grouping name appears in the Map To column.
If the field in the Map To column corresponding to the pass product with which you are working is blank, this means that the pass product has not yet been mapped to a pass grouping.
- Using your previously established pass grouping structure, complete the worksheet, as needed, by entering or updating a pass grouping value in each applicable pass product's corresponding field in the Map To column.
You can also use the Map To column to communicate entirely new pass grouping categories to Inntopia staff.
Note: Employee, complimentary, and industry pass types are typically not included in pass reporting; therefore, you may not want to map these types of pass products to a pass grouping.
- To help Inntopia staff identify which values to insert into your existing pass groupings, highlight or otherwise indicate which cells contain new or updated values.
- Save the file.
- Submit the updated worksheet file to Inntopia staff who will map the pass products to their designated pass groupings in the Passes table.


