Marketing Cloud Reports Dashboards
The Reports Dashboards within the Inntopia Marketing Cloud Insight portal provide an analysis of a specific subset of various types of your data. The dashboards currently available are described below.
- Dashboard-style reports provide a visual representation of your company's KPIs (key performance indicators) by including complementary data from multiple other reports. Showing easy-to-digest, high-level data in charts and graphs uncovers relevant business insights and trends. To further explore a specific trend, you can run the dashboard's corresponding report to view additional information.
- Each dashboard is accessible via the Reports menu within the Inntopia Marketing Cloud Insight portal.
- Each dashboard provides filters to narrow the data set presented within the dashboard. The filters vary per dashboard; however, all include a start and end date, and may include filters based on revenue type, campaign tags, survey ID, or pass groupings.
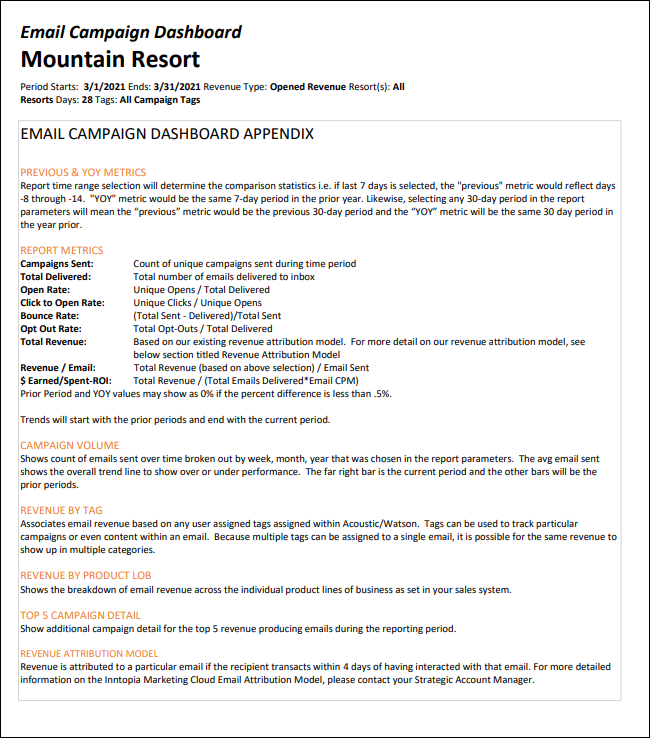
- All KPIs are defined in an appendix contained within each dashboard. Appendices are found on page two of dashboards viewed within the Insight portal. Appendices are also included when the dashboard is exported to a Microsoft® Excel or .PDF file.
Automated Email Summary Dashboard
Transact Confirmation Dashboard

